This chimes with what we’re seeing in Ahrefs Brand Radar, our new marketing intelligence tool which lets you track your brand presence in AI search.
We analyzed 25M AI overview keywords in the two-month window of our analysis.
Here’s what that data shows…
We analyzed 25M AI Overviews in the US and found that AI overviews have more than doubled since Google’s March Core Update.
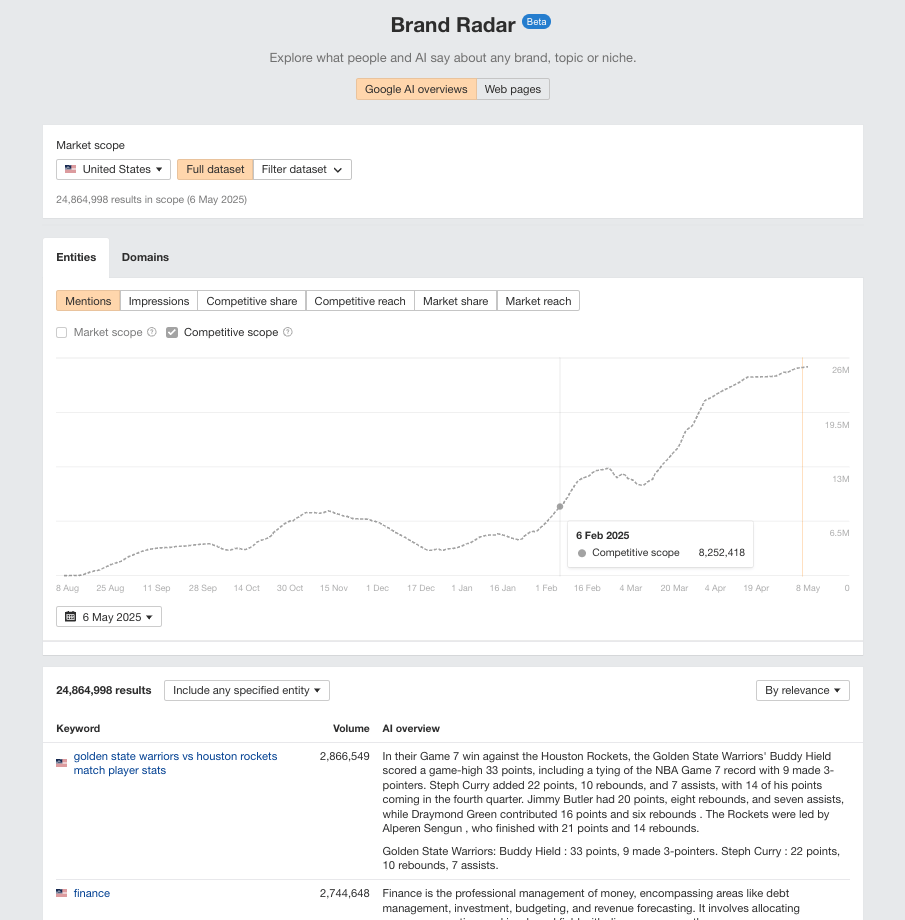
Ahrefs Brand Radar tracks global AI overview data on a daily basis, allowing us to analyze two months of US-based AI overviews.
We tracked the total number of AI overviews between the dates of 6th February and 6th May.
25 million AI overviews later, we noticed that the most substantial day-to-day change in the dataset (6.26%) occurred between March 12th and March 13th, coinciding with the rollout of Google’s latest Core Update on March 13th.
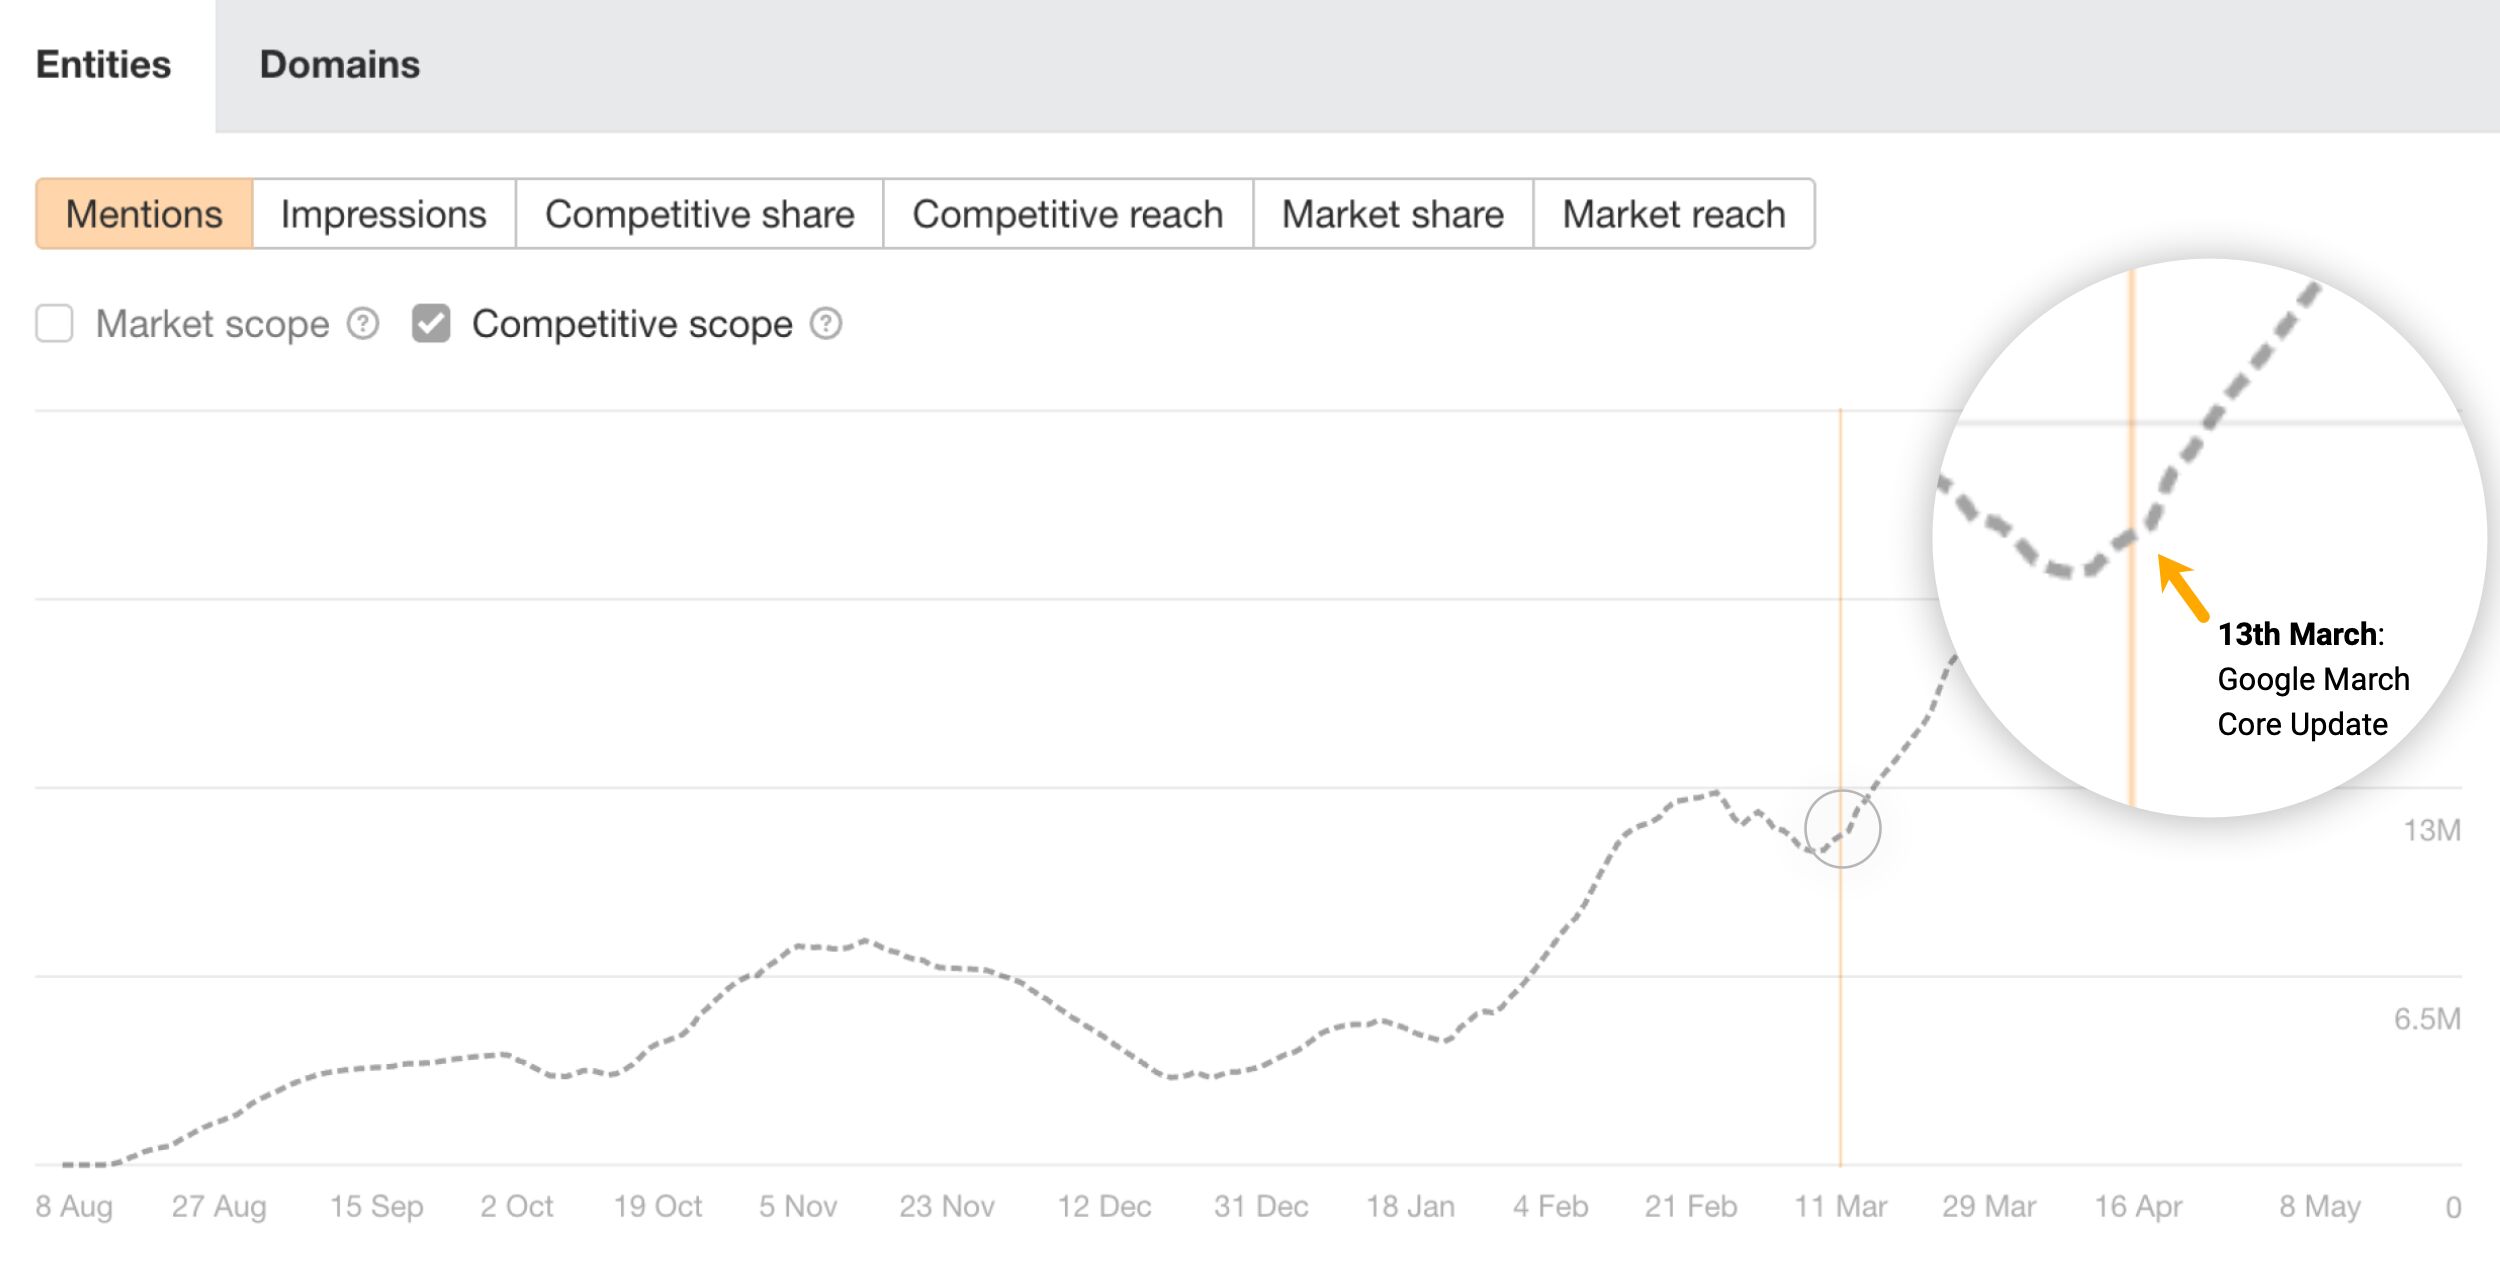
The total number of AI Overviews grew by 116% between March 12th (pre-update) and May 6th, according to our database.
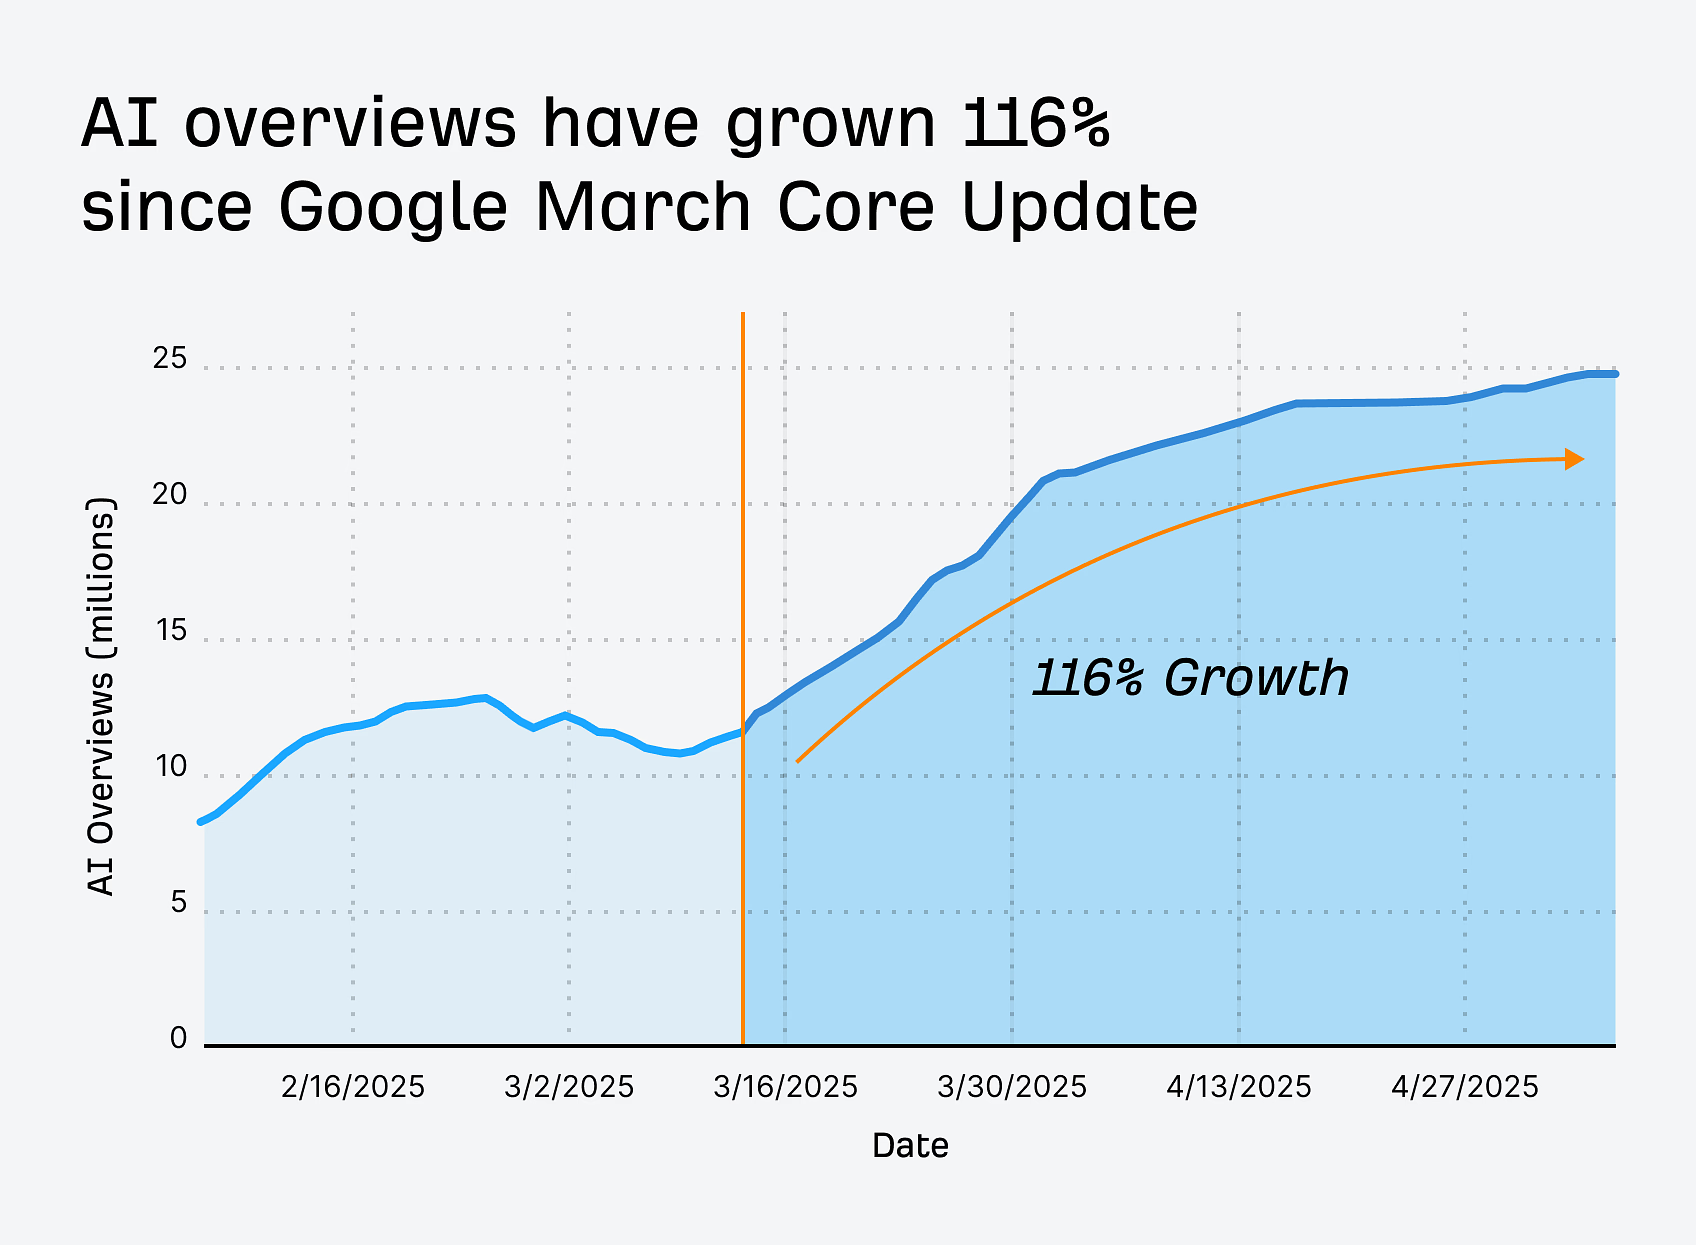
Comparing the month before the Core Update (February 10th – March 12th) to the month after (March 13th – April 12th), we also observed a 57% growth in total AI overviews.
After the March Core Update, cumulative growth (i.e. how AI overviews grew day-by-day, factoring in the effect of compounding) hit 87.27%, reflecting a strong, compounding upward trend.
| Period | Cumulative growth | Avg. daily growth rate |
|---|---|---|
| Before Core Update | 14.37% | 0.47% per day |
| After Core Update | 87.27% | 2.12% per day |
This kind of growth aligns with findings from BrightEdge. Their study showed that AI overviews in Entertainment, Restaurant, and Travel industries increased by 432% on average following the March Core Update.
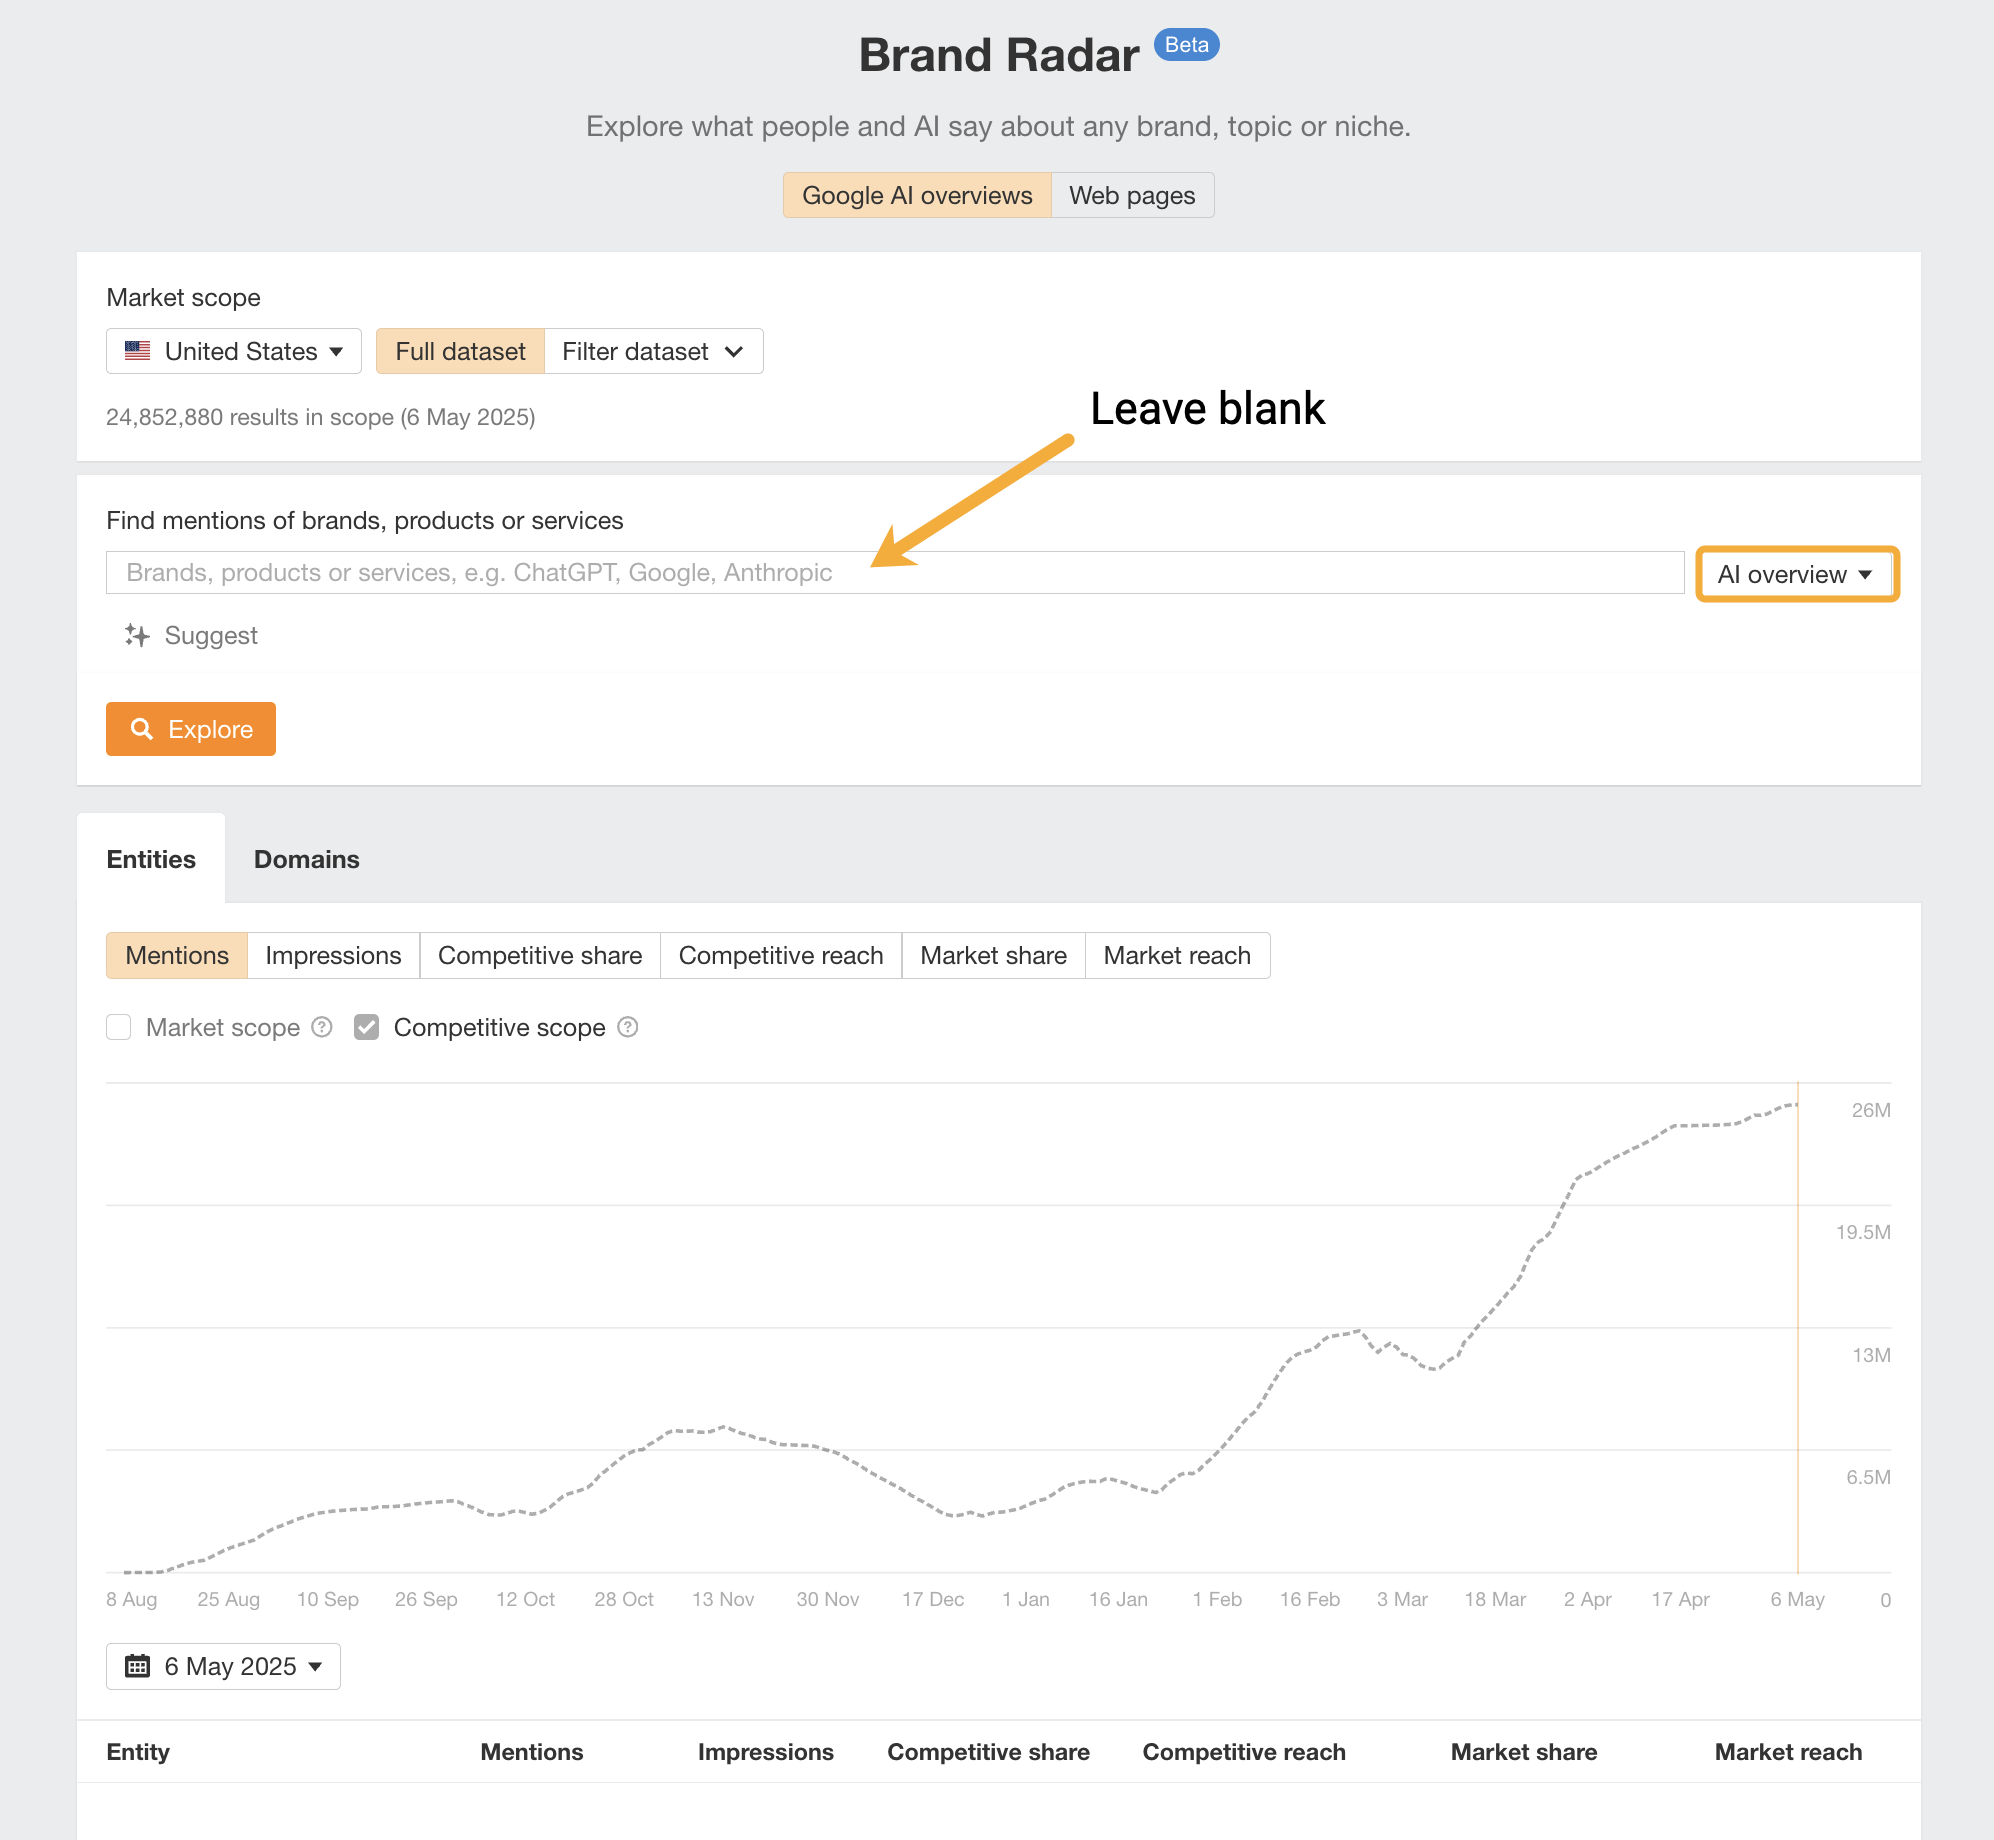
If you want to see post-update AI overview growth for yourself, just do an open/empty search in Ahrefs Brand Radar.
It’s important to note that Google’s March Core Update is not Google’s only AI overview expansion.
Our study pertains to US results, but Google also rolled out of AI overviews in the EU during this time.
And on March 5th, Google announced that it was rolling out AI overviews to more people
…teens can now use AI Overviews, and you’ll no longer need to sign in to get access.


Since that date, the number of AI overviews we track has grown by 119.32%.
At the time of writing, the percentage of US keywords triggering AI overviews in search results has also doubled–jumping to 16.48%, up from just 7.6% on March 13th.
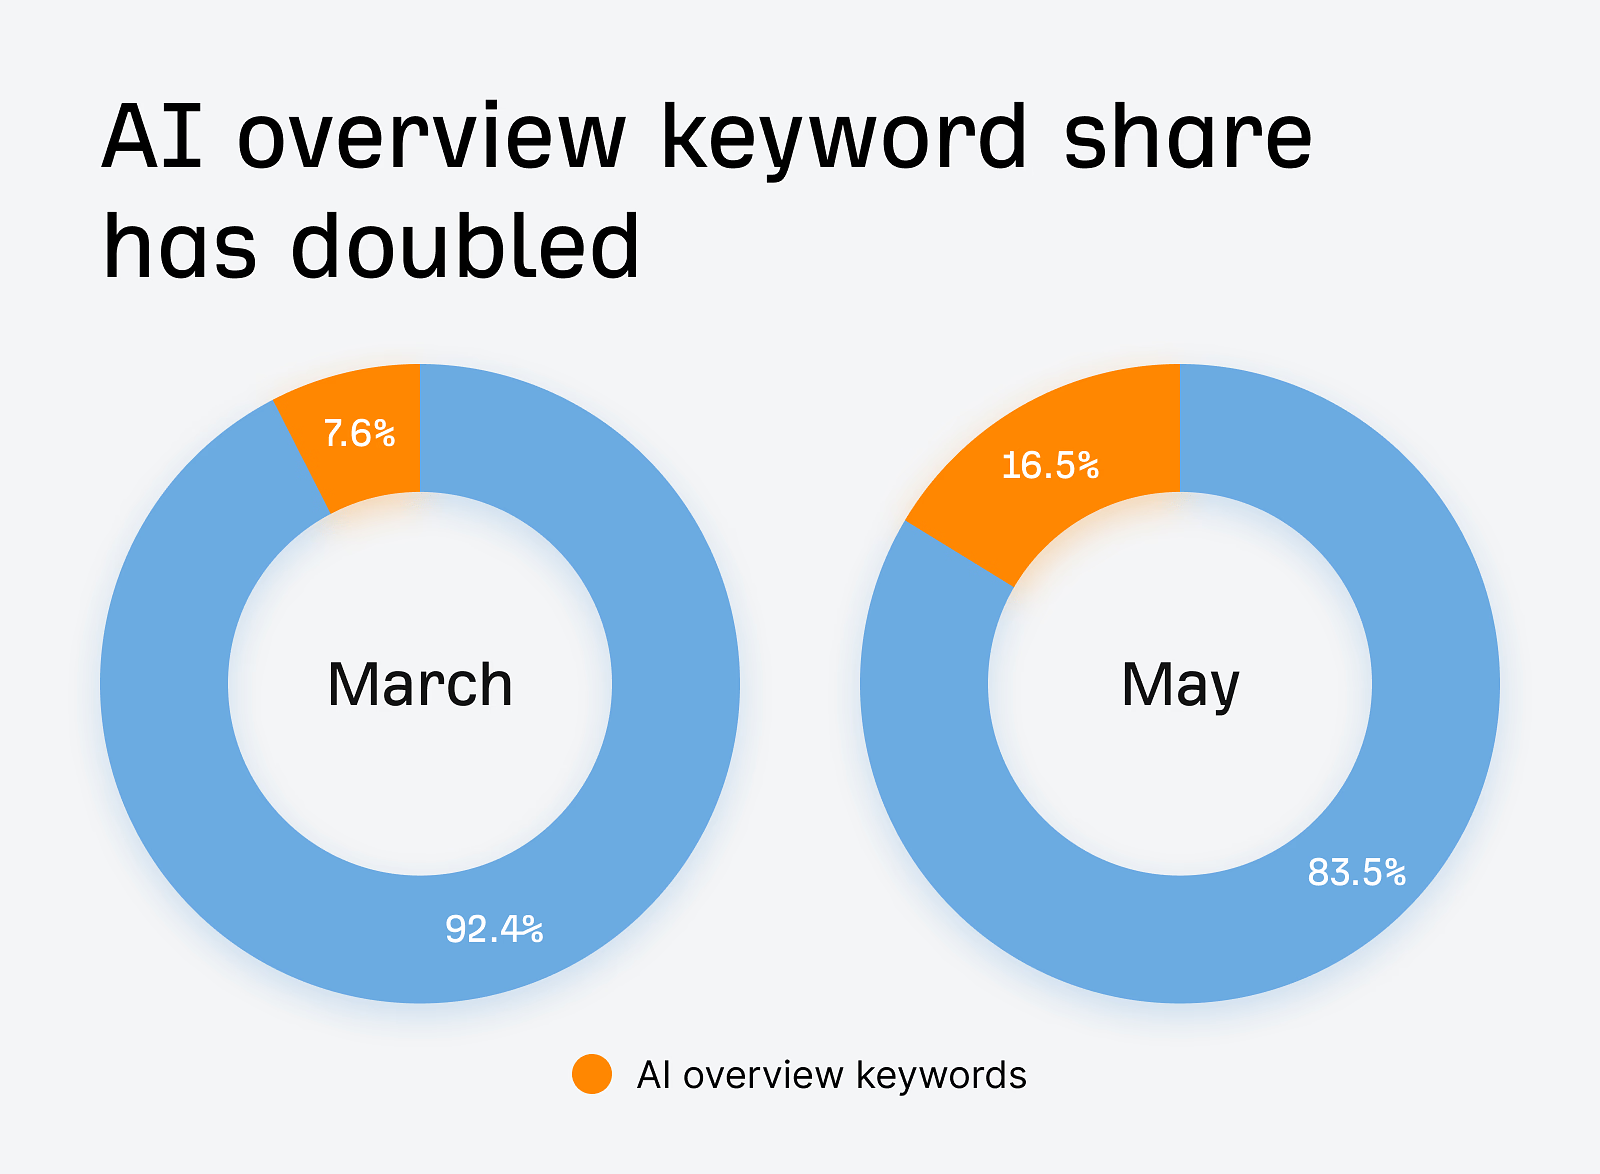
In other words, AI overviews haven’t just grown because the total # of keywords has grown. They now appear for twice as many searches, taking up a larger percentage of all keywords since the March Core Update.
Search volume shows similar growth: AI overviews now account for 11.8% of all US-based keyword search volume, compared to 6.2% on March 13th.
Recently, our Director of Content Marketing, Ryan Law, and our Data Scientist, Xibeijia Guan, published research revealing that AI Overviews cut clicks by 34.5%.
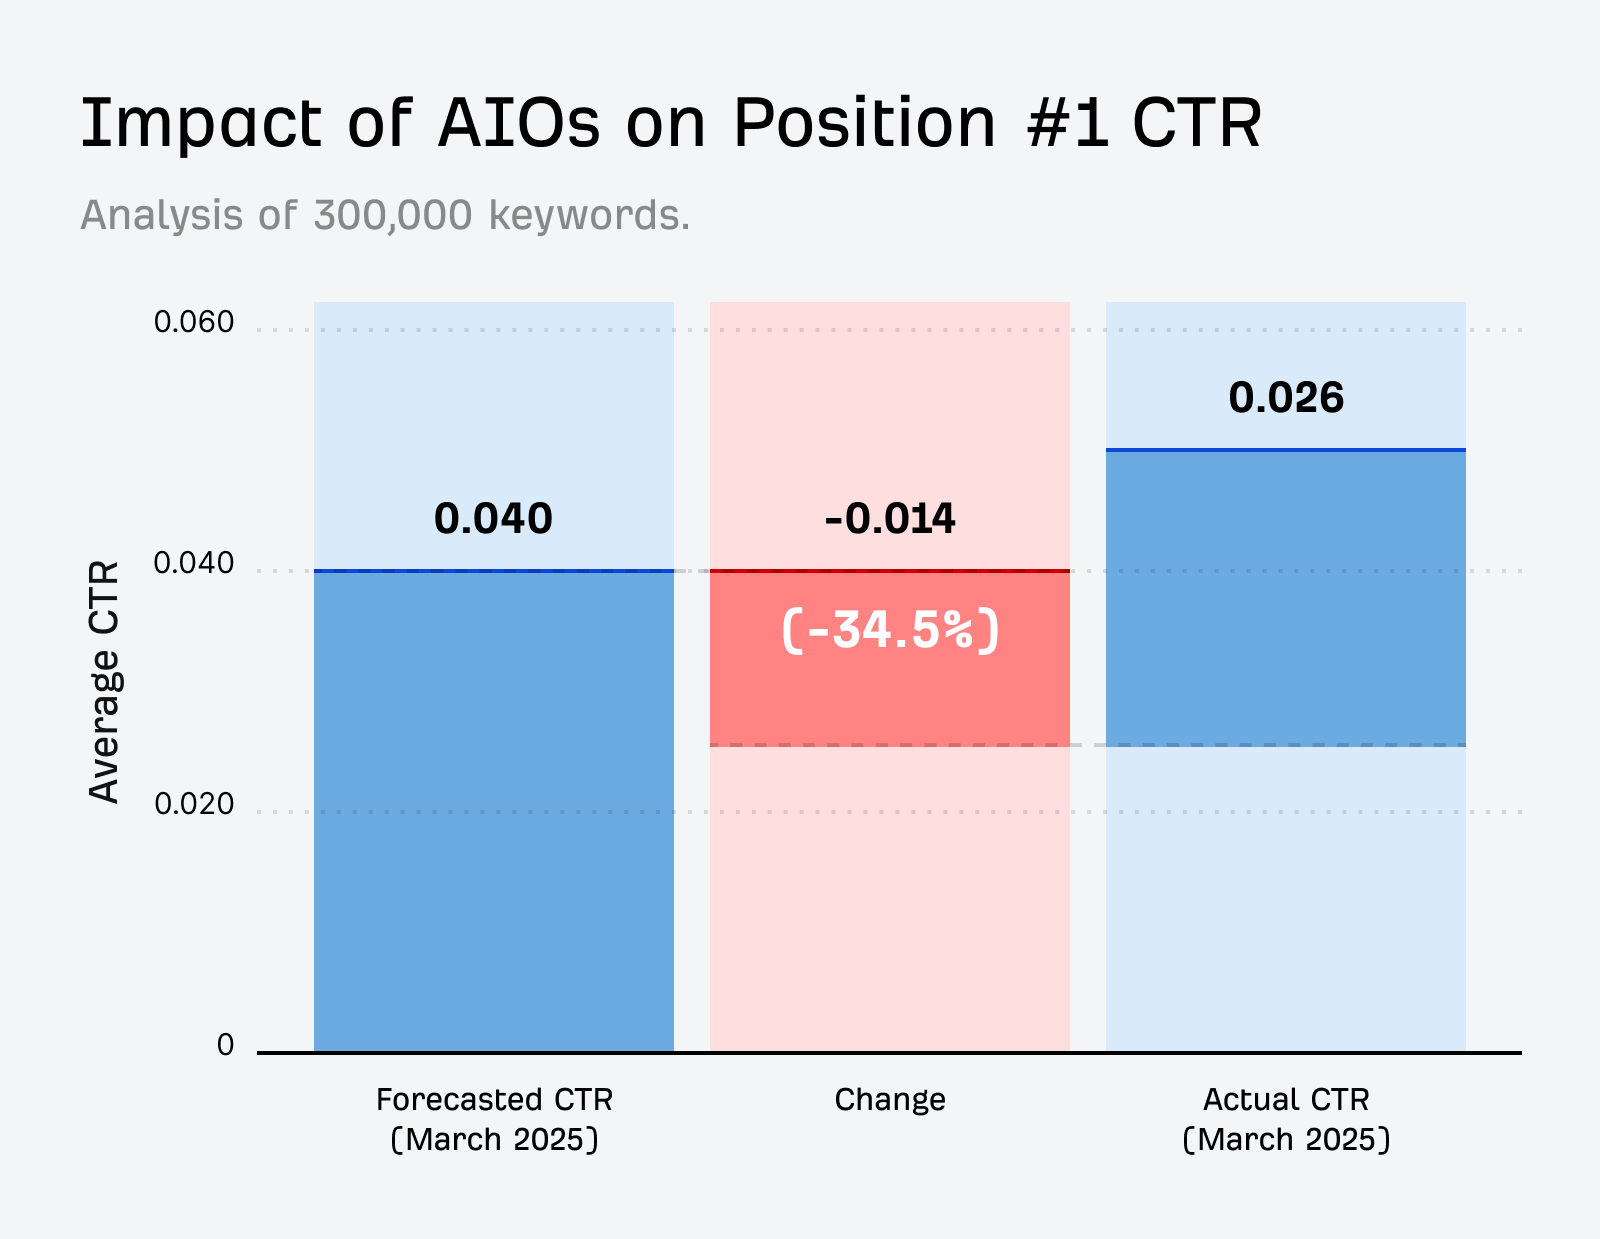
Since Ryan’s and Xibeijia’s study includes March 2025 data, the expansion of AI Overviews following the Core Update likely played a role in falling CTRs.
AI overviews are on the up and up since Google’s March Core Update and subsequent AI overview rollouts—so which sites are benefitting from that growth?
We headed to the new “Domains” report within Ahrefs Brand Radar to find out.
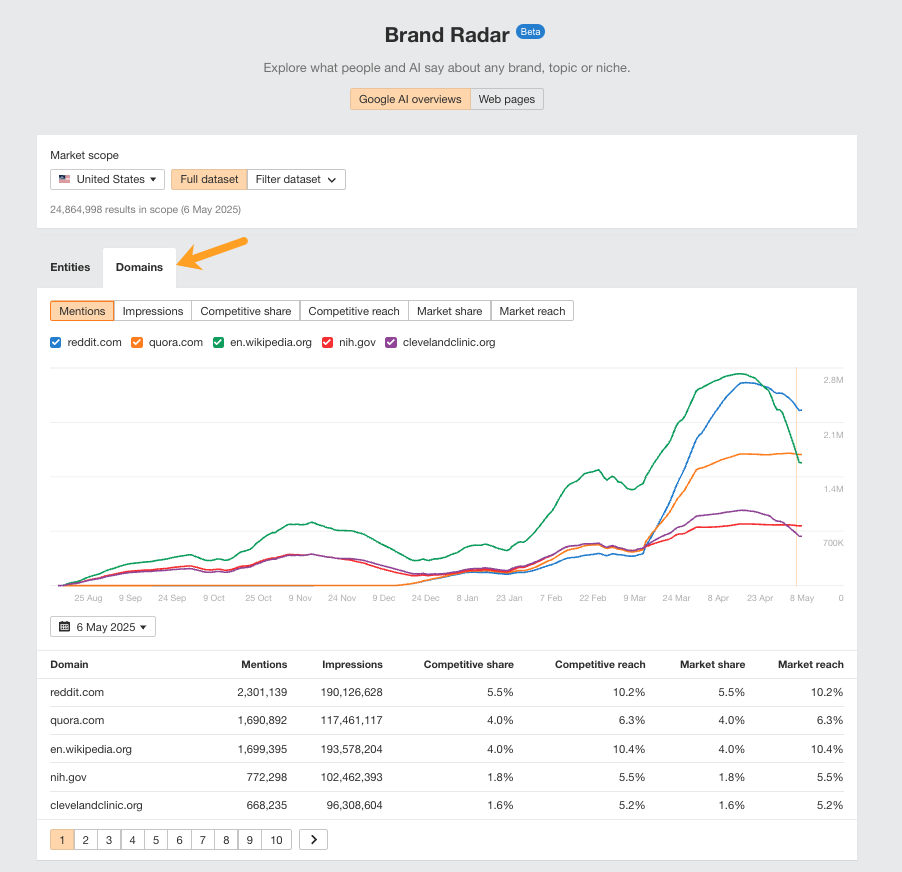
This report shows you the most referenced domains within the sitelinks of AI overviews.
We analyzed 40 domains on the 12th of March (e.g. the day before the Core Update) vs May 6th, based on their…
- AI overview market share: Percentage of citations across the total market.
- AI overview market reach: Percentage of citation impressions across the total market.
| Domain | AIO share | 📈 | AIO reach | 📈 | |
|---|---|---|---|---|---|
| 1 | reddit.com | 5.50% |
4.20% |
10.20% |
8.30% |
| 2 | quora.com | 4.00% |
2.60% |
6.30% |
8.30% |
| 3 | webmd.com | 1.50% |
0.70% |
6.50% |
3.70% |
| 4 | brainly.com | 0.60% |
0.50% |
1.00% |
0.70% |
| 5 | mayoclinic.org | 1.40% |
0.30% |
7.00% |
-2.00% |
| 6 | nih.gov | 1.80% |
0.30% |
5.50% |
0.40% |
| 7 | microsoft.com | 0.50% |
0.20% |
1.00% |
0.20% |
| 8 | justanswer.com | 0.40% |
0.20% |
0.40% |
0.20% |
| 9 | apple.com | 0.70% |
0.20% |
1.20% | 0.00% |
| 10 | clevelandclinic.org | 1.60% |
0.10% |
5.20% |
-3.60% |
| 11 | www.nhs.uk | 0.50% |
0.10% |
2.20% |
0.60% |
| 12 | support.google.com | 0.30% |
0.10% |
0.80% |
0.20% |
| 13 | aapc.com | 0.20% |
0.10% |
0.30% |
0.10% |
| 14 | quizlet.com | 0.20% |
0.10% |
0.20% | 0.00% |
| 15 | tripadvisor.com | 0.20% |
0.10% |
0.20% | 0.00% |
| 16 | instagram.com | 0.30% |
0.10% |
0.50% |
-0.10% |
| 17 | indeed.com | 0.40% |
0.10% |
0.60% |
-0.20% |
| 18 | verywellhealth.com | 0.40% |
0.10% |
0.50% |
-0.20% |
| 19 | medlineplus.gov | 0.30% |
0.10% |
1.10% |
-0.40% |
| 20 | merriam-webster.com | 0.30% | 0.00% | 3.30% |
1.10% |
| 21 | stackexchange.com | 0.30% | 0.00% | 0.40% | 0.00% |
| 22 | facebook.com | 0.30% | 0.00% | 0.50% |
-0.10% |
| 23 | goodrx.com | 0.20% | 0.00% | 0.30% |
-0.10% |
| 24 | dictionary.com | 0.20% | 0.00% | 1.10% |
-0.10% |
| 25 | linkedin.com | 0.20% | 0.00% | 0.20% |
-0.20% |
| 26 | businessinsider.com | 0.20% | 0.00% | 0.20% |
-0.30% |
| 27 | amazon.com | 0.40% | 0.00% | 0.70% |
-0.40% |
| 28 | sciencedirect.com | 0.30% | 0.00% | 0.60% |
-0.50% |
| 29 | harvard.edu | 0.20% | 0.00% | 0.30% |
-0.50% |
| 30 | cdc.gov | 0.20% | 0.00% | 0.50% |
-0.80% |
| 31 | petmd.com | 0.20% |
-0.10% |
0.30% |
-0.30% |
| 32 | yahoo.com | 0.20% |
-0.10% |
0.30% |
-0.40% |
| 33 | fandom.com | 0.20% |
-0.10% |
0.30% |
-0.50% |
| 34 | imdb.com | 0.20% |
-0.10% |
0.30% |
-0.50% |
| 35 | britannica.com | 0.40% |
-0.10% |
0.90% |
-1.90% |
| 36 | en.wikipedia.org | 4.00% |
-0.10% |
10.40% |
-4.70% |
| 37 | medicalnewstoday.com | 0.80% |
-0.20% |
1.30% |
-1.20% |
| 38 | youtube.com | 1.10% |
-0.20% |
1.50% |
-1.70% |
| 39 | healthline.com | 1.50% |
-0.20% |
2.20% |
-2.60% |
| 40 | study.com | 0.30% |
-0.40% |
0.50% |
-1.40% |
…and tracked any growth or decline between the two dates.
When it comes to “AI overview market share”, Reddit is far and away the most dominant player, showing up for 5.5% of all AI overview queries.
This was not the case before the March Core Update.
In fact, on March 12th, Reddit actually placed 6th in terms of AI overview market share, beneath the likes of Quora, Healthline, and Wikipedia.
| Domain | Market share | Market reach | |
|---|---|---|---|
| 1 | en.wikipedia.org | 4.10% | 15.10% |
| 2 | healthline.com | 1.70% | 4.80% |
| 3 | nih.gov | 1.50% | 5.10% |
| 4 | clevelandclinic.org | 1.50% | 8.80% |
| 5 | quora.com | 1.40% | 2.10% |
| 6 | reddit.com | 1.30% | 1.90% |
| 7 | youtube.com | 1.30% | 3.20% |
| 8 | mayoclinic.org | 1.10% | 9.00% |
| 9 | medicalnewstoday.com | 1.00% | 2.50% |
| 10 | webmd.com | 0.80% | 2.80% |
Reddit’s “AI overview market share” has shot up by 4.2% since the March Core Update, which means it has claimed millions of new domain citations in AI overviews.
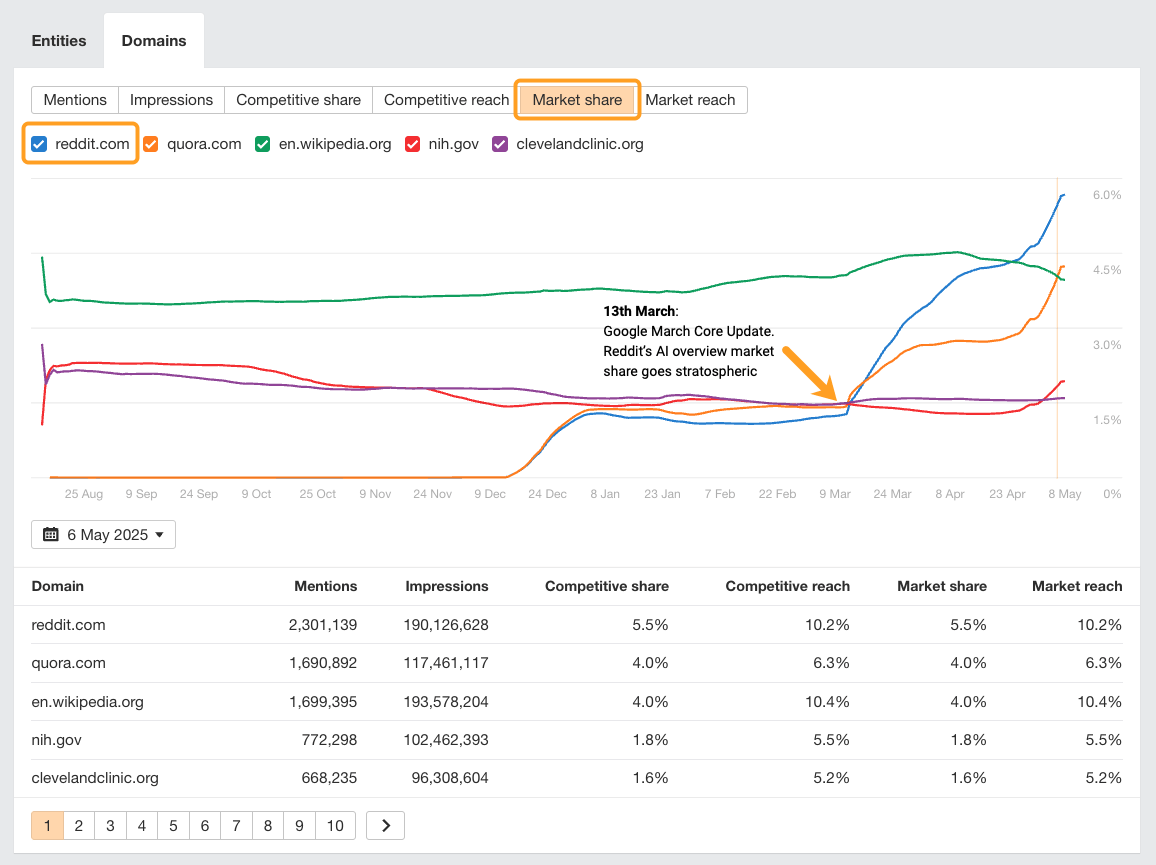
Quora is the only other site to have seen definitive growth in terms of AI overview market share—nearly every other site has experienced modest to negative growth (south of ~0.5%).
When it comes to the domains earning the most impressions in AI search, the winners are:
| Domain | AI overview reach | 📈 | |
|---|---|---|---|
| 1 | reddit.com | 10.20% |
8.30% |
| 2 | quora.com | 6.30% |
4.20% |
| 3 | webmd.com | 6.50% |
3.70% |
| 4 | merriam-webster.com | 3.30% |
1.10% |
| 5 | brainly.com | 1.00% |
0.70% |
These sites have seen significant growth across some of the most visible AI overview keywords in our database.
Meanwhile, the following sites have gone the other way.
| Domain | AI overview reach | 📈 | |
|---|---|---|---|
| 1 | en.wikipedia.org | 10.40% |
-4.70% |
| 2 | clevelandclinic.org | 5.20% |
-3.60% |
| 3 | healthline.com | 2.20% |
-2.60% |
| 4 | mayoclinic.org | 7.00% |
-2.00% |
| 5 | britannica.com | 0.90% |
-1.90% |
Despite having the highest reach (10.4%) of any domain—surpassing even Reddit—Wikipedia has lost more visible AI overview keywords (4.7%) than any other site we analyzed.
Forums and UGC dominate AI overviews
Forums and Q&A sites like Reddit and Quora have benefited most from the AI overview surge since Google’s March Core Update.
They’ve seen the strongest growth pattern out of all domain categories.
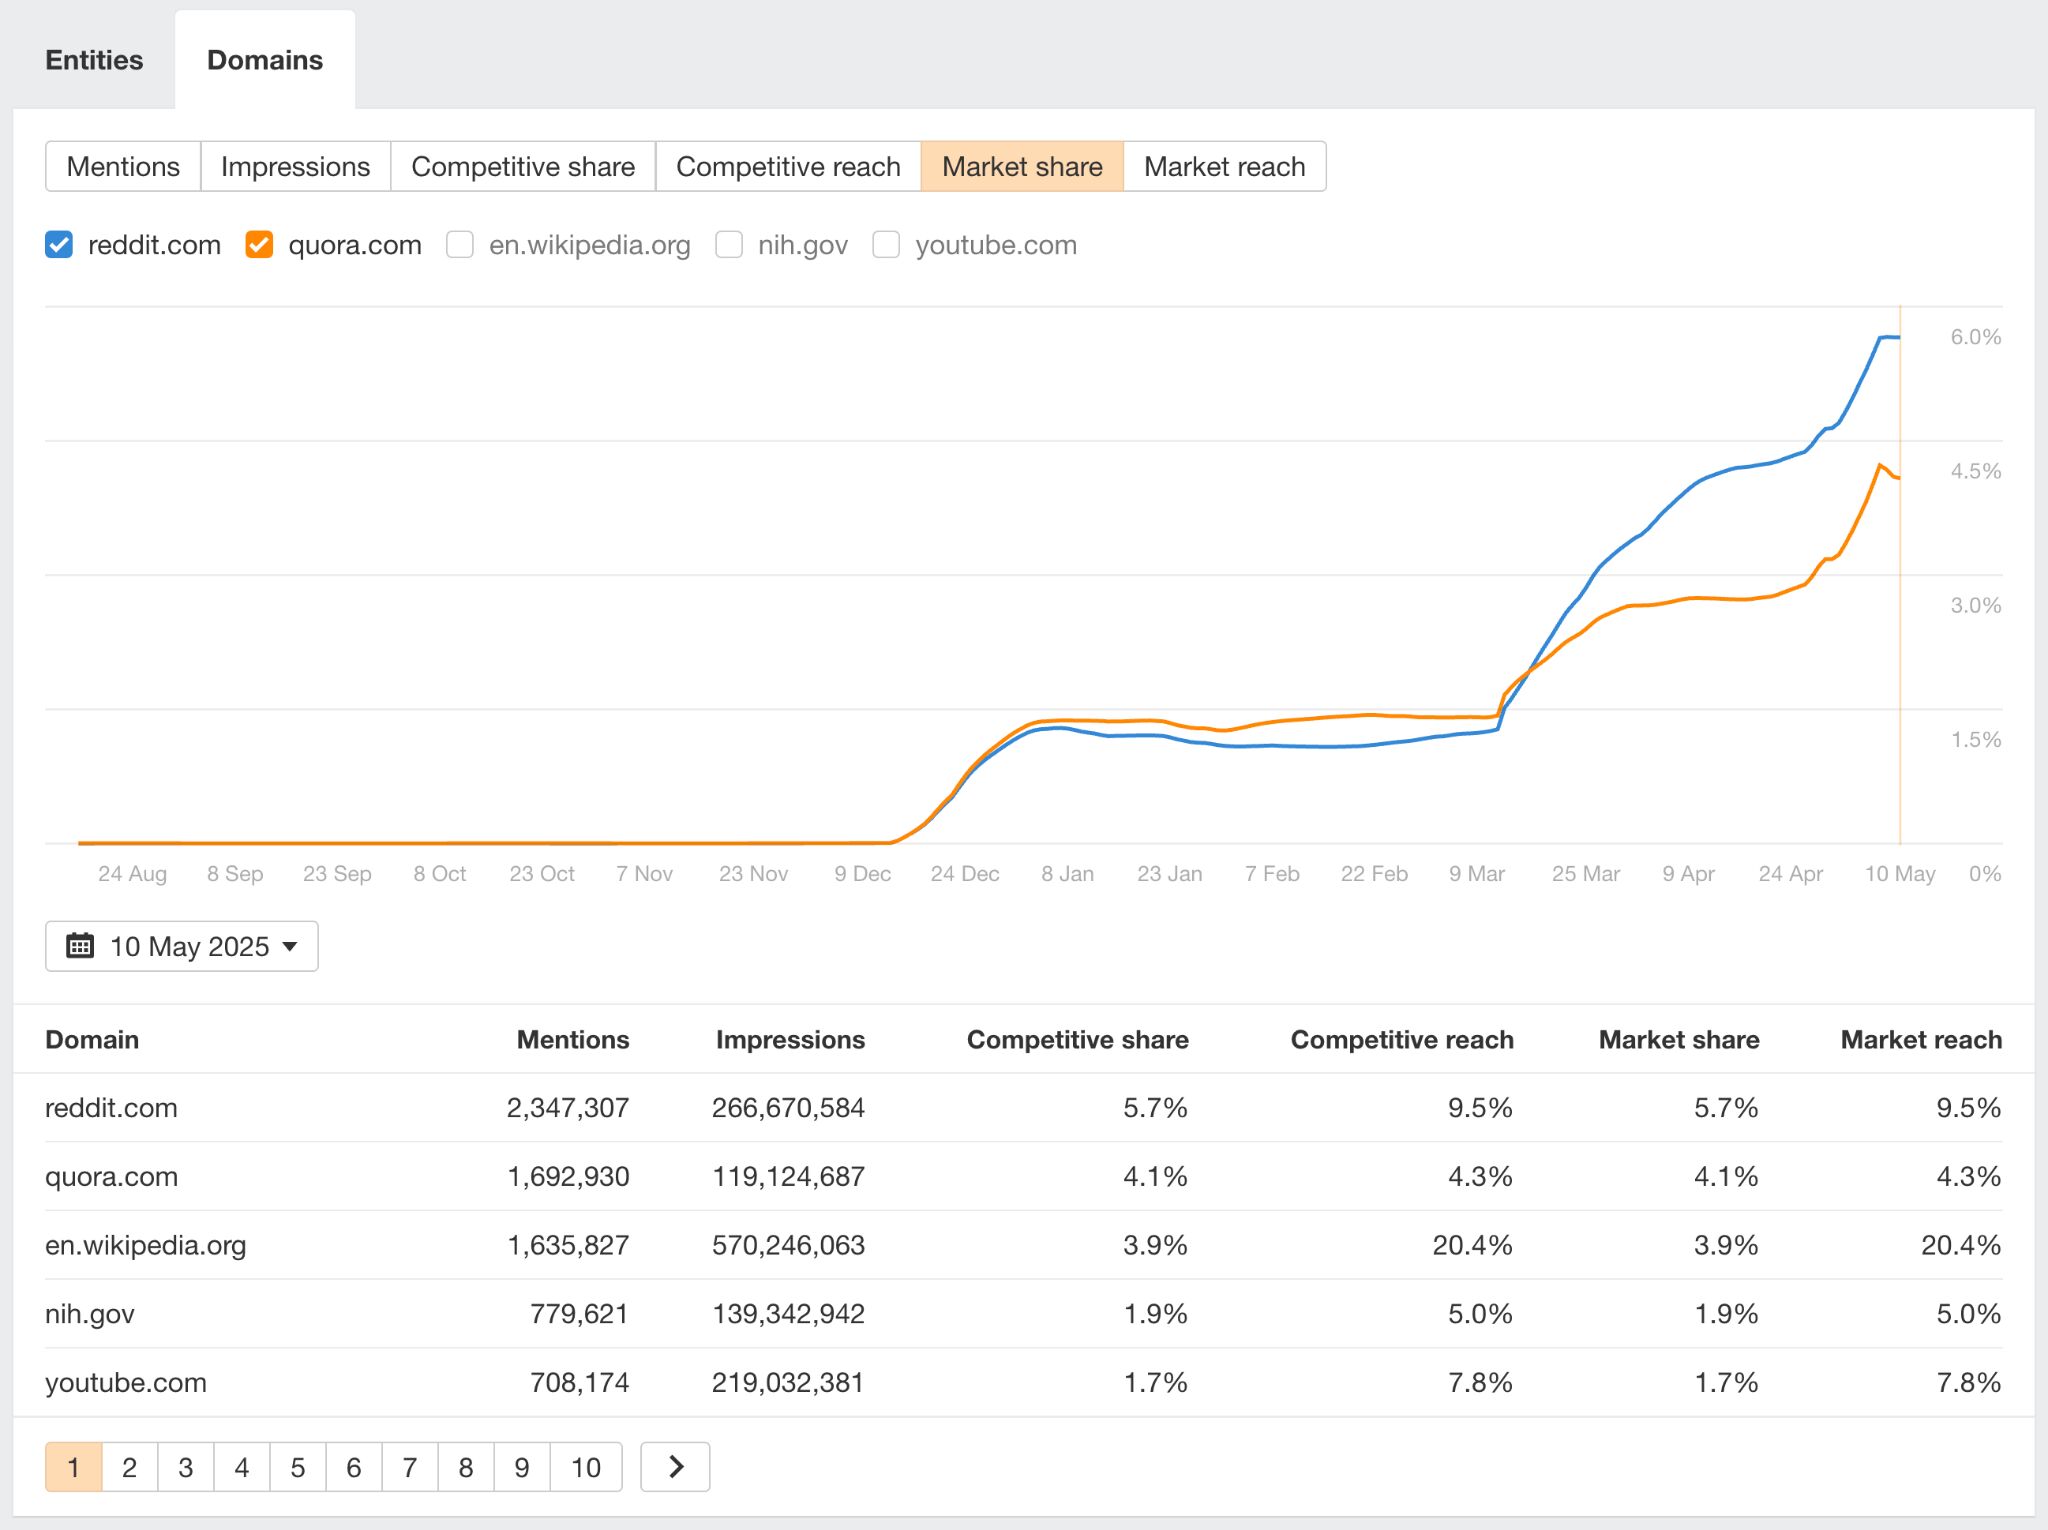
One possible explanation is that forums are inherently conversational, which aligns totally with the Q&A format of AI overviews.
Most sites saw neutral or positive gains
Two-thirds of the domains we analyzed saw neutral or positive growth in AI overview market share following Google’s March Core Update. On average, AI overview market share grew by 0.21%.
However, AI overview market reach experienced a slight decline (-0.13%), indicating that a smaller number of dominant websites are hoovering up some of the more visible AI overview keywords.
It’s worth noting that our analysis focused only on the 40 most cited domains in AI overviews.
It’s entirely possible that things could look very different across a larger dataset.
Here’s how you can keep tabs on the trajectory of AI overviews, on the whole, and in your niche.
Check Ahrefs Brand Radar
As I already mentioned, for a top-level, industry-agnostic AI overview of market and trend data, you can do an open search in Brand Radar.
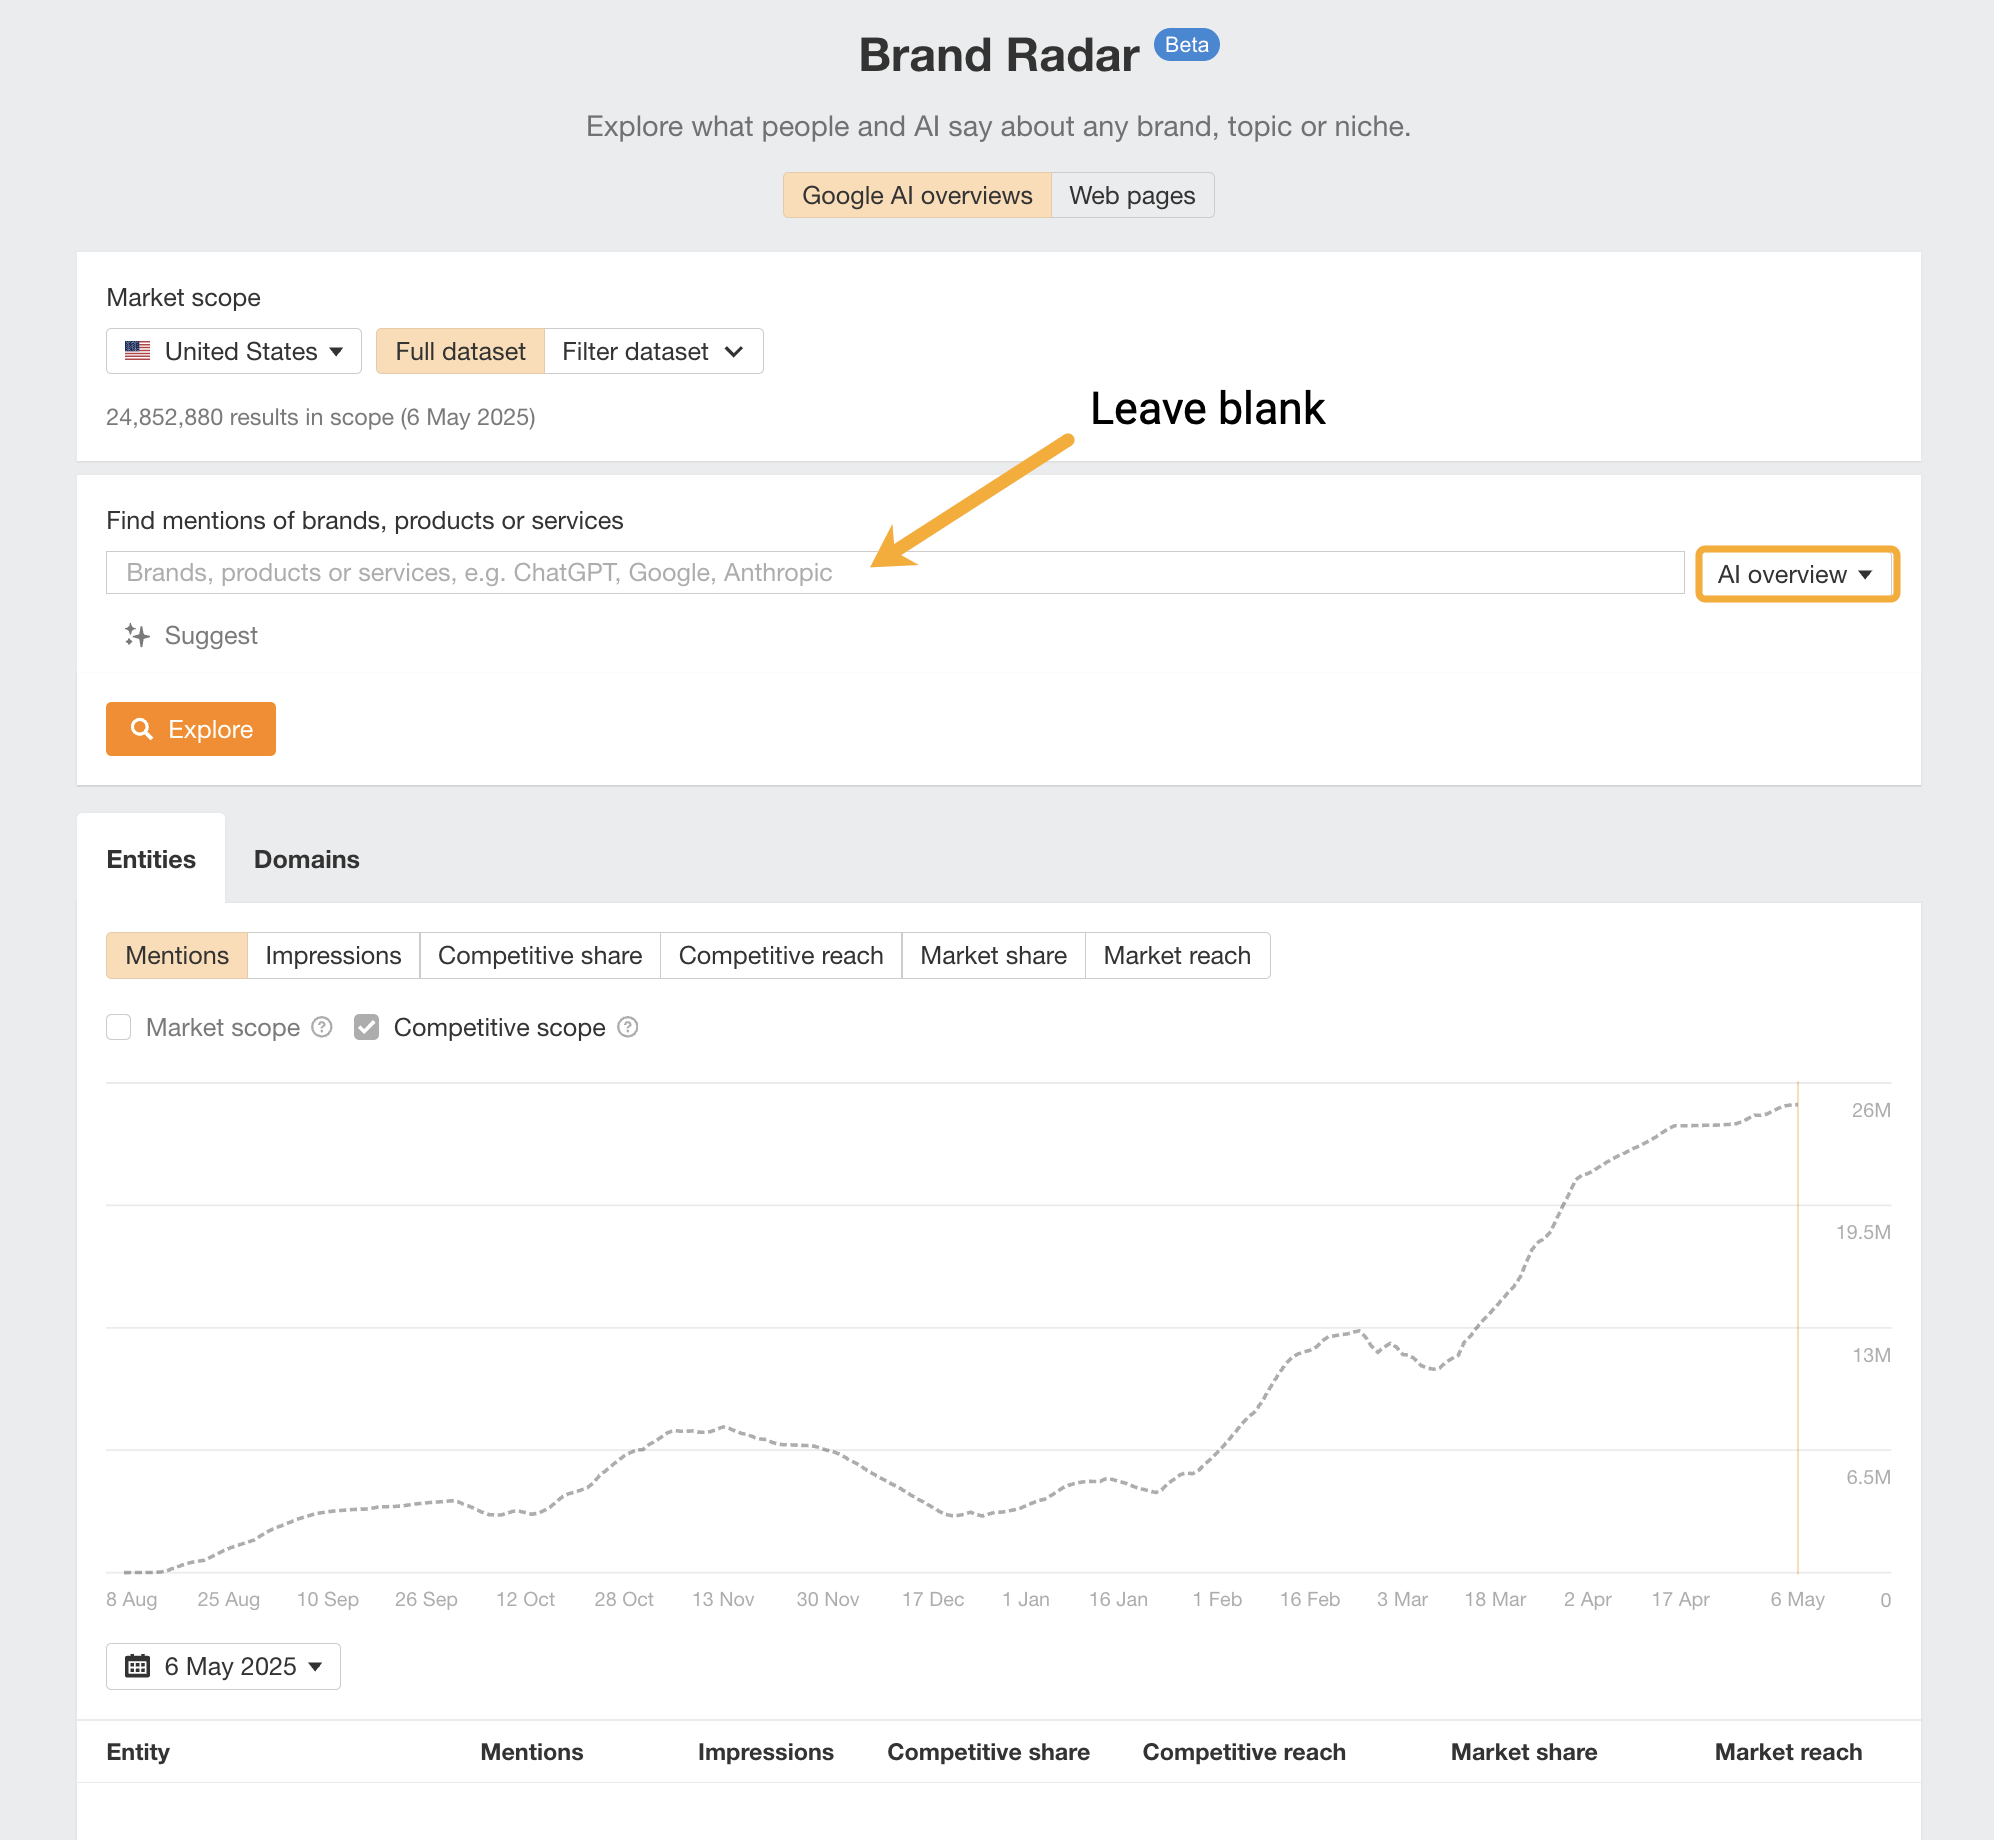
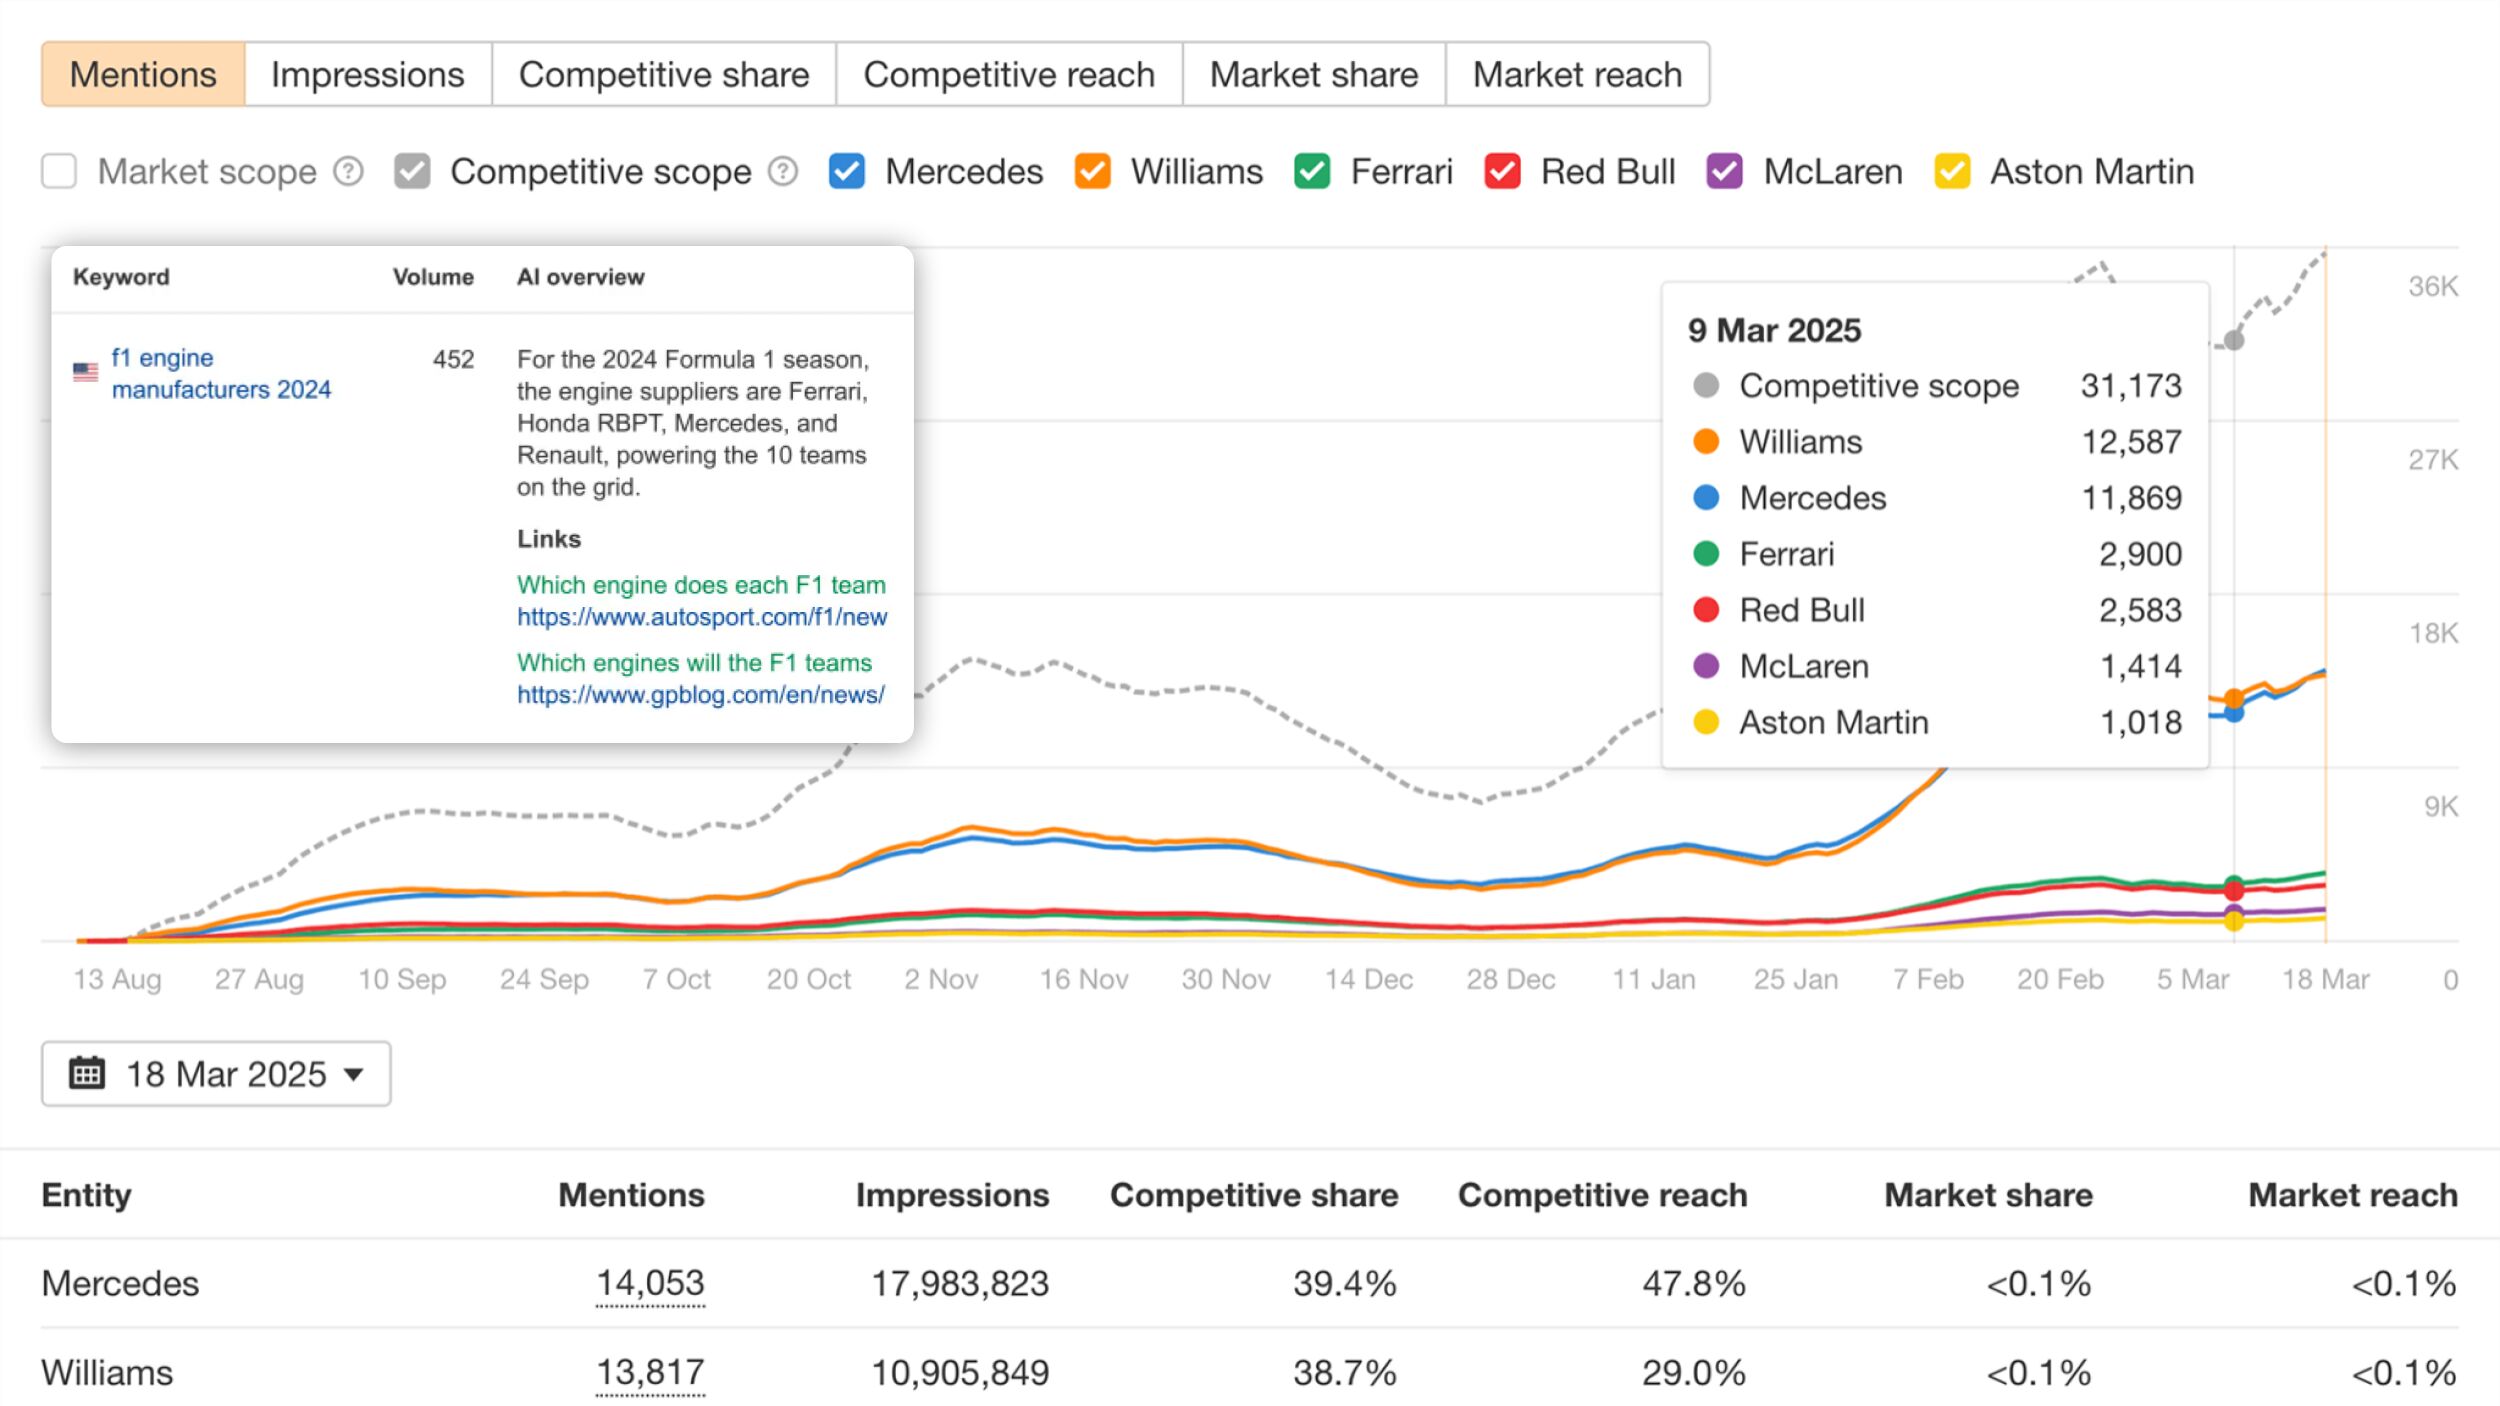
But you can also use Brand Radar to track growth across mentions of words you care about (e.g. brand, competitors, products, topics) in AI overview queries and AI overview outputs.
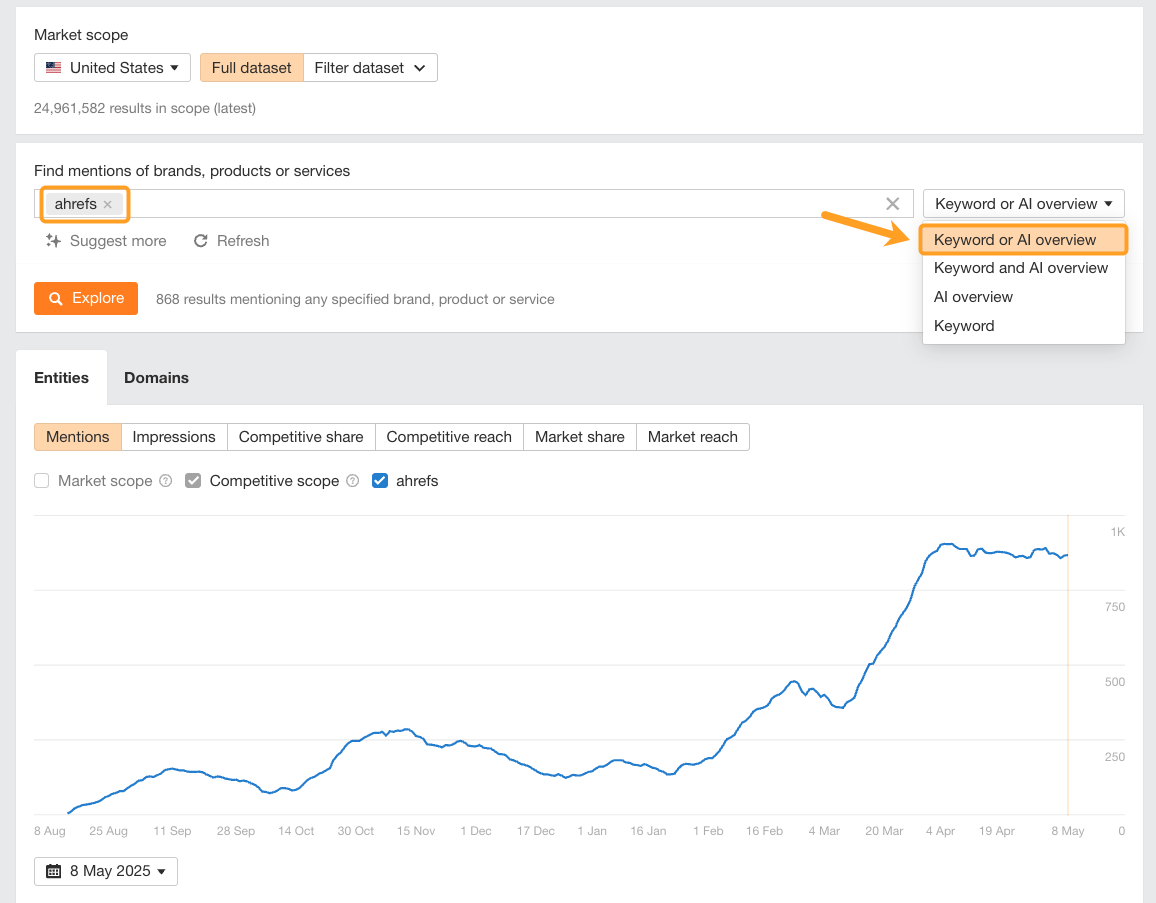
For example, say I wanted to assess the growth of “Ahrefs” mentions in both AI overview keywords and AI overview content, I can drop that keyword into the search bar, and select “keyword OR AI overview”.