



Keeping up with the growing demands of data analysis and reporting isn’t easy. I’ve seen teams struggle with endless spreadsheets, disconnected data sources, and the pressure to transform raw numbers into clear insights quickly. When data starts to feel complex, effective visualization and analysis become essential, and that’s where free analytics platforms can make a real difference.
The challenge is that many analytics tools come with high price tags that not every team can afford. I know firsthand that investing in advanced BI platforms isn’t always realistic, especially when the goal is simply to streamline reporting or understand everyday performance metrics.
That’s why I explored a range of free analytics platforms and dashboard software that help transform complex data into intuitive, visual insights, without adding to your expenses. These tools make it easier to analyze trends, track KPIs, and cut down the time spent on manual reporting.
In this guide, I’ll walk you through the best free dashboard solutions available today, sharing feature highlights, real user feedback, and practical pros and cons to help you choose the right platform for your data needs.
10 best free dashboard software for 2026
- Alteryx: Best for preparing and analyzing data before dashboarding
For intuitive, no-code workflows that automate data preparation and advanced analytics. - Amazon QuickSight: Best for AWS users needing scalable BI
For ML-powered insights and effortless integration with the AWS data ecosystem. - Domo: Best for collaborative, cloud-based business dashboards
For real-time data syncing across departments with strong mobile accessibility. - Looker: Best for customizable dashboards built on Google’s ecosystem
For creating highly flexible, shareable dashboards that connect smoothly with Google services. - Microsoft Power BI: Best for users in the Microsoft ecosystem
For combining powerful data modeling with seamless Excel and Azure integrations. - Qlik Sense: Best for uncovering hidden insights with associative analytics
For its associative data model that lets users explore relationships across all data points. - Sigma: Best for spreadsheet-style analytics at cloud scale
For a familiar spreadsheet interface that connects directly to live cloud data. - Sisense: Best for analyzing large datasets at speed
For in-chip technology that accelerates processing and delivers fast, interactive dashboards. - Strategy One: Best for enterprise-grade analytics and governance
For robust security, governance, and advanced visualizations suitable for large organizations. - Tableau: Best for interactive, exploration-driven dashboards
For turning complex data into dynamic, drag-and-drop visualizations with real-time analysis.
* The software list is arranged alphabetically. These tools offer free trials, free forever options, or freemium models.
Comparison of the best free dashboard software
If you feel overwhelmed by the wealth of information about free data dashboard software, this comparison table will help you with all the significant aspects:
| Best free dashboard software | G2 Rating | Free plan | Paid plan |
| Alteryx | 4.6/5 ⭐️ | A free trial is available (for desktop and cloud) | $250/user/month |
| Amazon QuickSight | 4.3/5 ⭐️ | 30-day free trial | Starting at $24/user/month |
| Domo | 4.3/5 ⭐️ | 30-day free trial | Custom pricing |
| Looker | 4.4/5 ⭐️ | Available to use for free | Custom pricing |
| Microsoft Power BI | 4.5/5 ⭐️ | Available with limited features | Starting at $10/user/month |
| Qlik Sense | 4.4/5 ⭐️ | 30-day free trial | Starting at $200/month |
| Sigma | 4.4/5 ⭐️ | A free trial is available | Custom pricing |
| Sisense | 4.2/5 ⭐️ | 7-day free trial | Custom pricing |
| Strategy One | 4.2/5 ⭐️ | 30-day free trial | $13/user/month |
| Tableau | 4.4/5 ⭐️ | A free trial is available | $15/user/month |
*All pricing details mentioned in the article are based on publicly available data at the time of publication and are subject to change.
10 best free dashboard software I recommend
The demand for dashboard software continues to grow as teams rely more on data to track performance, spot trends, and make faster decisions. From marketing and sales to product and operations, dashboards have become a central way to turn raw data into clear, actionable insights.
As businesses generate more data across various tools and platforms, the need for intuitive and flexible dashboard solutions has increased significantly. These tools help teams visualize key metrics, monitor progress in real time, and share insights without relying on complex reports or spreadsheets.
From my experience, “best” doesn’t always mean “paid.” Some free dashboard software I’ve used has delivered impressive capabilities, allowing me to build interactive dashboards, connect multiple data sources, and create meaningful visualizations without a heavy investment.
That’s why I’ve curated this list of the best free dashboard software I recommend. Each option offers a practical way to explore dashboarding fundamentals, understand where a tool shines, and decide whether upgrading makes sense as your data needs grow.
How did I find and evaluate these free dashboard software?
To build this list, I started with G2 Data, shortlisting top-rated tools based on their G2 scores and consistent performance in the dashboard software category.
From there, I reviewed product capabilities and recent, verified user feedback to confirm that these tools deliver practical value and to understand where each one stands out, whether that’s data visualization quality, ease of integration, customization options, or real-time reporting.
The goal was simple: to see whether these dashboard tools live up to their claims, what each one is best suited for, and whether there’s a free version or free trial you can try with minimal risk. Because this is a free-focused list, I paid close attention to what you can actually do without paying, such as the number of dashboards you can create, data source limits, refresh frequency, and feature restrictions that might require an upgrade.
The screenshots featured in this article may be a mix of those taken from the vendor’s G2 page or from publicly available materials.
The list below contains real user reviews from the best free analytics software category pages. It’s important to note that in the context of this list, vendors offering a free trial are also considered free. To be included in this category, a solution must:
- Provide robust data ingestion, integration, and preparation features as part of the platform
- Consume data from any source through file uploads, database querying, and application connectors
- Allow for the modeling, blending, and discovery of data
- Create reports and visualizations with business utility
- Create and deploy internal analytics applications
* This data was pulled from G2 in 2025. Some reviews may have been edited for clarity.
1. Alteryx: Best for preparing and analyzing data before dashboarding
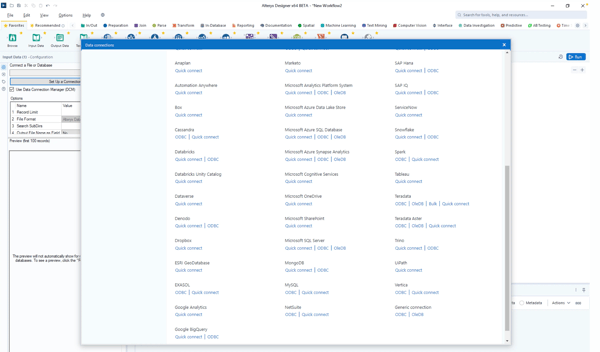
Alteryx is a data analytics platform known for its ability to prepare, blend, and analyze data from various sources. It offers an intuitive, drag-and-drop interface that simplifies the complex process of data preparation and analytics, making it accessible to both technical and non-technical users. According to G2 Data, it ranks as the 3rd easiest to use tool.
Alteryx has a free trial for both desktop and cloud infrastructure and offers community support.
Pros and cons of Alteryx: At a glance
| Pros of Alteryx | Cons of Alteryx |
| Provides free learning resources and tutorials | May need business intelligence tool integrations for advanced visualization needs |
| Simplifies data preparation and analytics with an easy-to-use interface. | Requires substantial system resources for optimal performance |
| Offers strong community support and resources, even to free users | Premium plans may get expensive for small businesses and individual users |
What G2 users like about Alteryx:
“I really appreciate Alteryx for its user interface, which allows me to easily create workflows without having to code. It works seamlessly with data sources, giving me access to analytics tools for predictive and spatial analysis, along with data cleaning capabilities. The automation feature simplifies tasks, making data processing more consistent and efficient. Additionally, the vibrant Alteryx Community offers templates and advice, which makes learning a breeze. What’s great is that it can handle both datasets and big data, catering perfectly to my data requirements.”
– Alteryx Review, Leandro L.
What G2 users dislike about Alteryx:
“One of the drawbacks is the presence of some bugs accompanying version upgrades. Because of this, I hesitate to adopt the latest version immediately. However, in most cases, these issues are resolved through patches, so it’s not a serious concern. Furthermore, bugs are often linked to Alteryx, as it continuously releases new tools and features. In that sense, it’s not necessarily negative and can be seen as beneficial for users in the long term.”
– Alteryx Review, Ippei N.
Want more advanced charts and deeper visual storytelling? Explore the best data visualization software to go beyond basic dashboards and uncover richer insights.
2. Amazon QuickSight: Best for AWS users needing scalable BI
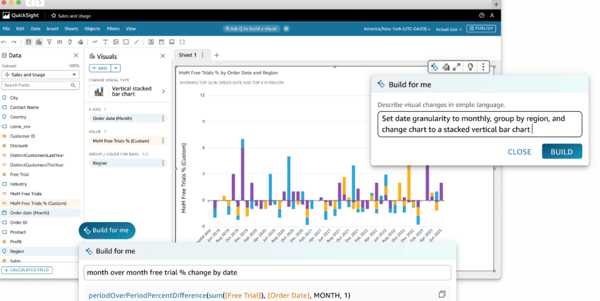
Amazon QuickSight is a cloud-powered business intelligence service from Amazon Web Services (AWS) designed to deliver fast and easy-to-understand insights through interactive dashboards. It uses machine learning to offer predictive analytics, making it perfect for data-driven organizations looking to gain actionable insights.
The platform is available for free for 30 days for up to 4 users per account.
Pros and cons of Amazon QuickSight: At a glance
| Pros of Amazon QuickSight | Cons of Amazon QuickSight |
| Integrates effortlessly with other AWS platforms | Exporting dashboards and reports may be more clunky than other platforms |
| Highly scalable and grows with your data needs | Depending on the location, there may be slight data latency issues |
| Uses ML to provide predictive analytics and uncover hidden data patterns | Advanced customization features may be limited for some use cases |
What G2 users like about Amazon QuickSight:
“I like Amazon Quicksight the best because it is easy to use. I can also integrate easily with my products. There are many features I can use that are helpful for my company. It is easy to implement and integrate. Finally, customer support is beneficial.”
– Amazon QuickSight Review, Abanob M.
What G2 users dislike about Amazon QuickSight:
“Advanced functionality in the dashboard is pretty limited. There is an equivalent to Dax, but in comparison, it’s much more limited. The error message it gives you sometimes looks like SQL syntax and references nested case statements, which makes me think the function has been converted to some sort of simple SQL function behind the scenes. We don’t need to do many advanced calculations in our datasets, but even then, I have run into things that just can’t be done.”
– Amazon QuickSight Review, Abhishika M.
3. Domo: Best for collaborative, cloud-based business dashboards
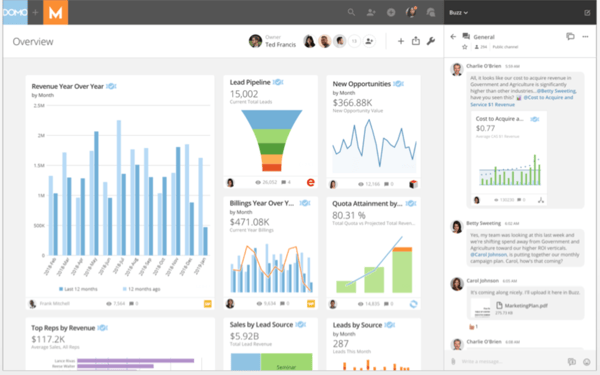
Domo is a cloud-based business intelligence platform with a comprehensive range of data visualization and reporting tools. It’s known for its scalability and integrates various data sources to create customizable and interactive visualizations. Domo makes data accessible to technical and non-technical users, driving collaborative decision-making.
The free tool is available to test out for 30 days with full access to all features and unlimited business users.
Pros and cons of Domo: At a glance
| Pros of Domo | Cons of Domo |
| The cloud-based architecture is easy to scale up | Limited offline functionality, like other cloud-based tools |
| Offers real-time data analytics, supporting timely decisions | The initial setup and data integration processes can be complex |
| Has a mobile app for on-the-go functionality | Pre-built customizations are somewhat limited |
What G2 users like about Domo:
“I love that Domo is easily able to go with whatever my needs are. If I need to filter, sort through my company’s many warehouses and locations, or upload a CSV to NetSuite, the process is very simple yet effective. Domo was very easy to implement across all departments in our company – Operations, Finance, and Sales- and all use the system equally daily. The frequent use allows us to catch small mistakes or errors and quickly correct them for our customers.”
– Domo Review, Myishia M.
What G2 users dislike about Domo:
“Sometimes, obvious enhancements would make life easier in the system, such as being able to sort preview results. The chart properties layout isn’t always intuitive, either; there are so many options that it becomes hard to know where to find certain options.”
– Domo Review, Katja R.
If your dashboards focus on campaign performance, traffic, or conversions, take it further with the best marketing analytics tools for deeper attribution and ROI tracking.
4. Looker: Best for customizable dashboards built on Google’s ecosystem
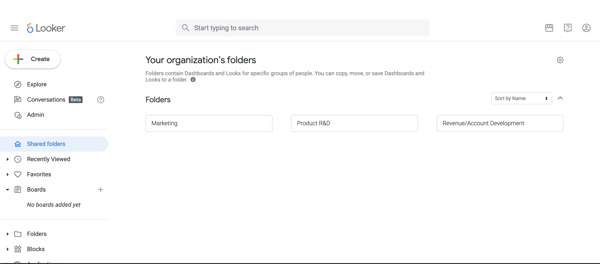
Looker is a robust analytics platform with its modern, cloud-based architecture designed to optimize data exploration and reporting. The software lets users transform complex datasets into actionable insights through customizable, interactive dashboards. Looker’s data modeling layer, LookML, allows users to create personalized reports. Based on G2 Data, Looker sees the strongest adoption in the mid-market, with 61% of its users coming from this segment.
Looker Studio is available at no charge for creators and report viewers.
Pros and cons of Looker: At a glance
| Pros of Looker | Cons of Looker |
| Has a clean, easy-to-use interface, making it easy to create reports and build dashboards | Creating advanced data models and queries may require a good understanding of SQL |
| Offers highly customizable dashboard designs that can be tailored to user needs | Works on a cloud-based model, which means offline support is minimal |
| Offers excellent integration capabilities with other Google services | The range of built-in visualization options may be limited |
What G2 users like about Looker:
“Everything is free and user-friendly in the Google Data Studio, which allows users to create customized dashboards. Looker Studio offers work on both real-time and dummy data. It collaborates with many data sources and creates fantastic reports. One of my best things is to apply filters to sort out data within seconds.”
– Looker Review, Muhammad M.
What G2 users dislike about Looker:
“Looker has a limited number of graphs and chart visualizations available, so customizations are limited to a certain level. Also, there’s very little control over data refreshes, which can sometimes slow the dashboard when working with a lot of data.”
– Looker Review, Mariam J.
5. Microsoft Power BI: Best for enterprise-grade analytics and governance
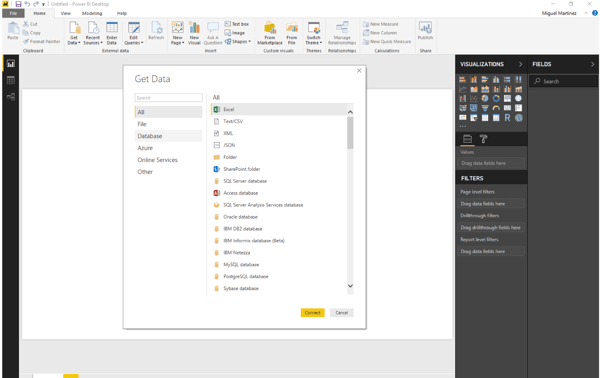
Microsoft Power BI is a leading analytics software that transforms complex data into interactive, easy-to-understand reports and dashboards. Integrated within the Microsoft ecosystem, Power BI enables users to connect to various data sources seamlessly and provides robust tools for data modeling, visualization, and sharing insights across organizations. According to G2 Data, it ranks as the 2nd easiest to use tool.
The free plan is included with a Microsoft Fabric free account for creating rich and interactive reports and dashboards.
Pros and cons of Microsoft Power BI: At a glance
| Pros of Microsoft Power BI | Cons of Microsoft Power BI |
| Simplifies the data visualization process with its intuitive drag-and-drop features | Dependent on an internet connection for lag-free functionality |
| Continuously updated with new features and improvements | Limited customization options compared to business dashboard software |
| Integrates effortlessly with other Microsoft products like Excel and Azure | Performance constraints with vast datasets and complex queries |
What G2 users like about Microsoft Power BI:
“Power BI has a user-friendly interface, powerful visualization capabilities, and the drag & drop feature. The most helpful feature is Power Query’s robust data modeling and transformation tools, which streamline data cleaning and automation.”
– Microsoft Power BI Review, Ranjan K.
What G2 users dislike about Microsoft Power BI:
“Power BI offers many powerful features, but its wide range of functionalities can make the initial learning challenging, especially for users with limited experience in data analysis and visualization tools. Improving the user onboarding process and documentation could help facilitate the adaptation.”
– Microsoft Power BI Review, Erik F.
6. Qlik Sense: Best for uncovering hidden insights with associative analytics
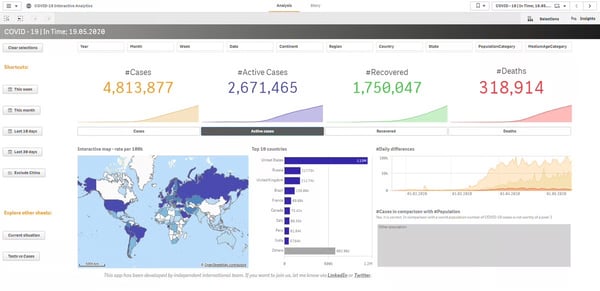
Qlik Sense is a recognized analytics and business intelligence tool designed to help organizations derive actionable insights from their data. With its unique associative data model, Qlik Sense facilitates highly interactive and visually appealing dashboards that allow users to explore data freely and uncover hidden relationships.
There’s a free trial available for 30 days for all new users.
Pros and cons of Qlik Sense: At a glance
| Pros of Qlik Sense | Cons of Qlik Sense |
| Uses AI to help uncover hidden insights and patterns | Faces performance bottlenecks with large data sets |
| Suitable for organizations of all sizes | Advanced features are locked behind paid versions |
| Integrates with various data sources, both on-premise and cloud | Has a steep learning curve for beginners |
What G2 users like about Qlik Sense:
“It has been a powerful tool where we can connect to the data source so that it returns information and data that is analyzed more quickly to generate more detailed reports more easily. I like its ease of use from the start without having an extensive learning curve.”
– Qlik Sense Review, Steven M.
What G2 users dislike about Qlik Sense:
“The three main points on which the tool can be improved are undoubtedly: to allow a greater possibility of native customization, to allow fewer links to scripting and more wizards, and finally to provide certified and officially maintained extensions.”
– Qlik Sense Review, Filippo O.
7. Sigma: Best for spreadsheet-style analytics at cloud scale
Sigma empowers businesses to explore and analyze data directly and intuitively. With its spreadsheet-like interface, Sigma makes data analytics accessible to users of all technical backgrounds, facilitating collaborative data exploration and dashboard creation. According to G2 Data, it ranks as the 5th easiest to use tool.
New users can enjoy Sigma’s free trial without any commitment.