


Picking the right one from the best AIOps tools in the market directly affects how quickly your team detects, understands, and resolves incidents. With many tools offering similar promises around automation, correlation, and noise reduction, buyers now need clearer signals to evaluate which platform truly fits their environment and operational model.
IT ecosystems continue to generate growing telemetry volumes and alert streams, making platform choice a practical decision tied to response speed and service reliability. Market growth reflects this shift. The global AIOps platform market is projected to grow from $11.7 billion in 2023 to $32.4 billion by 2028 at a 22.7% CAGR, showing how organizations are investing in tools that help teams move from alert overload to confident incident resolution.
My evaluation of the top AIOps tools is based on aggregated patterns across real user reviews and ongoing exposure to teams running AIOps platforms in production environments. The assessment focuses on criteria that consistently distinguish effective platforms: depth of anomaly detection and correlation, breadth of data ingestion, automation maturity, and integration with existing observability and ITSM tooling. G2 review patterns suggest that tools lacking in these areas often generate false positives or leave engineers manually stitching workflows together, which raises long-term operational overhead.
TL;DR: The top 10 AIOps tools as per G2 scores are Atera, ServiceNow IT Operations Management, IBM Instana, Dynatrace, Datadog, SysAid, Rakuten SixthSense Observability, New Relic, IBM Turbonomic, and Digitate.
10 best AIOps tools for 2026: My top picks
- Atera: Best for centralized IT operations with built-in automation
Remote monitoring, patching, and ticketing are combined into a technician-based model that reduces per-endpoint cost complexity. (Paid plans start at approximately $149 per technician/month, billed annually) - ServiceNow IT Operations Management: Best for enterprise AIOps and service operations
Event management, service mapping, and operational intelligence are tightly connected to CMDB and ITSM workflows. (Pricing publicly available on request, custom quotes only) - IBM Instana: Best for automated APM and fast deployment
AI-driven tracing and infrastructure visibility are designed to surface issues quickly in distributed systems. (Paid plans start at $20 per MVS/month) - Dynatrace: Best for full-stack observability with AI-assisted root cause analysis
Infrastructure, application, and digital experience monitoring unified under a single automation-driven platform. (Infrastructure monitoring starts at approximately $7 per host/month, billed annually) - Datadog: Best for engineering-led observability for cloud-native stacks
Metrics, logs, and traces combined with broad integrations and flexible analysis workflows. (Infrastructure monitoring starts at around $15 per host/month, billed annually) - SysAid: Best for ITSM teams with built-in automation and AI assistance
Ticketing, asset management, and workflow automation are designed for internal IT operations. (Pricing publicly available on request; custom quote required) - Rakuten SixthSense Observability: Best for unified observability with AI-driven insights
Application, infrastructure, and data observability capabilities are positioned around correlation and operational intelligence. (Free plan available; Pro starts at $10 per monitored table/month; enterprise pricing is quote-based) - New Relic: Best for full-stack observability with AI-driven insights
Full-stack monitoring with flexible data ingest and user-based access controls. (Free tier available; paid usage starts at close to $0.40 per GB beyond included data) - IBM Turbonomic: Best for automated resource optimization and cost control. Automated decisions for workload placement and scaling across cloud and on-prem environments. (Pricing publicly available on request)
- Digitate (ignio): Best for enterprise AIOps and autonomous IT operations
Event correlation, root cause analysis, and automated remediation are designed for large-scale IT operations. (Pricing publicly available on request)
*These AIOps tools are top-rated in their category based on G2’s Grid Report. I’ve included their strengths and pricing details to help you choose the right platform for your operations and reliability workflows.
10 best AIOps tools I recommend
Modern operations teams sit on a large volume of signals, metrics, logs, events, and alerts that rarely agree with each other. AIOps tools exist to bring order to that chaos by connecting those signals into a single operational narrative that teams can trust. The right platform doesn’t just surface more data. It helps teams see what’s related, what’s urgent, and what can be safely ignored before small issues escalate.
The strongest AIOps platforms go beyond alert aggregation. They explain why an issue is happening, how it propagates across services, and which components are driving impact. Whether it’s correlating events across infrastructure and applications, surfacing recurring incident patterns, or using automation to reduce manual triage, the best tools replace noise with operational clarity.
This value isn’t limited to massive enterprises. G2 Data shows adoption spread across small teams, mid-market organizations, and large enterprises. Teams use AIOps at different scales, but for similar reasons: faster detection, clearer prioritization, and fewer reactive firefights. Most platforms are designed to plug into existing observability and ITSM stacks, which shortens time to impact and reduces disruption.
Ultimately, effective AIOps tools deliver what modern operations depend on: visibility into what’s breaking now, confidence in why it’s happening, and predictability in how teams respond. When that foundation is in place, incidents resolve faster, trust in automation improves, and critical issues stop slipping through unnoticed.
How did I find and evaluate the best AIOps tools?
I used G2’s Grid Reports for the AIOps category to identify platforms with consistently high user satisfaction and strong market presence across small teams, mid-market organizations, and large enterprises. This helped narrow the field to tools that are actively used in production environments, not just evaluated in theory.
Next, I analyzed hundreds of verified user reviews using AI to surface recurring patterns around what actually matters in day-to-day operations. The focus wasn’t on feature lists. It was on outcomes that teams repeatedly talked about: alert noise reduction, event correlation accuracy, root cause explanation, speed of incident detection, automation reliability, and how well the platform integrates with observability, ITSM, and cloud infrastructure stacks. These patterns made it clear which tools reduce operational load and which ones simply move complexity around.
Since I haven’t personally used every platform on this list, I validated these findings by cross-checking them with input from SRE, IT operations, and platform teams who actively rely on AIOps tools in live environments.
Product visuals and references included in this article are sourced from G2 vendor listings and publicly available product documentation to ensure accuracy and consistency.
What makes the best AIOps tools worth it: My criteria
Based on G2 user reviews and studying real-world SRE and IT operations workflows, and speaking with reliability engineers, IT ops leaders, and platform teams, the same themes showed up repeatedly. Here’s what I prioritized when evaluating the best AIOps tools:
- High-fidelity signal ingestion with meaningful noise reduction: The best AIOps tools make it possible to ingest massive volumes of metrics, logs, traces, and events without overwhelming operators. This means deduplication, alert suppression, temporal clustering, and context-aware filtering that reflects system behavior. A platform that reduces alert volume while preserving signal quality consistently leads to faster detection and higher trust during incidents.
- Accurate correlation across systems, services, and dependencies: Not all incidents originate from a single component. I looked for platforms that correlate signals across infrastructure, applications, services, and cloud resources using topology and dependency awareness. Tools that clearly show how issues propagate across systems stood out because they help teams focus on causes instead of chasing symptoms.
- Explainable root cause analysis teams can act on confidently: Beyond detection, strong AIOps Tools explain why the behavior deviated from normal and which component triggered the impact. I prioritized platforms that tie root cause insights back to observable telemetry, configuration changes, or dependency shifts. Tools that offer transparent, traceable explanations reduce hesitation and speed up decision-making under pressure.
- Operational automation that reduces toil without removing control: Automation should eliminate repetitive work, not introduce risk. I rated tools higher when they support automated enrichment, classification, routing, and remediation with clear safeguards and human override options. Platforms that allow teams to tune, audit, and pause automation help reduce on-call fatigue without sacrificing accountability.
- Deep integration with observability, ITSM, and cloud workflows: Great AIOps tools don’t operate as standalone dashboards. They integrate seamlessly with observability stacks, incident management systems, CMDBs, and cloud platforms. The best tools sync alerts, incidents, service context, and ownership automatically, reducing context switching and shortening the path from detection to resolution.
- Scalability across data volume, architecture, and team growth: Operational complexity grows quickly as systems scale. I prioritized platforms that maintain correlation accuracy, performance, and usability as telemetry volume increases and architectures evolve. Tools that scale from small environments to enterprise operations without degrading clarity earn stronger long-term adoption.
- Actionable insights instead of dashboard overload: Teams don’t lack charts. They lack direction. The strongest AIOps tools surface impact, affected services, probable causes, and recommended next steps. I rated platforms higher when insights directly guide action rather than requiring operators to interpret dense visualizations during incidents.
- Reliability, governance, and enterprise readiness: AIOps platforms must remain dependable when systems are under stress. I looked for tools that support role-based access control, audit logs, compliance requirements, and strong uptime guarantees. Enterprise teams also value SSO, data governance, and steady performance across large, complex environments where failures have real business impact.
Based on these criteria, I filtered down the AIOps tools that deliver operational clarity, reduce investigation time, and scale with real-world complexity. Not every platform excels at every capability, so the right choice depends on whether your priority is automation depth, explainability, scalability, or governance.
Below, you’ll find authentic user reviews from the AIOps Tools category. To appear in this category, a tool must:
- Analyze and correlate operational data across metrics, logs, events, and traces
- Support anomaly detection, incident correlation, and root cause analysis
- Integrate with observability, ITSM, and cloud infrastructure workflows
- Provide actionable insights that improve incident response speed and reliability
This data was pulled from G2 in 2026. Some reviews may have been edited for clarity.
1. Atera: Best for centralized IT operations with built-in automation
Atera is known as an AIOps platform shaped by the practical needs of day-to-day IT work rather than enterprise optics. Its overall G2 score of 86 reflect strong trust among teams that rely on monitoring, automation, and remote management as core operational tools rather than advanced analytics layers.
About 61% of users come from small businesses, 35% from mid-market teams, and only 4% from enterprises. This mix points to a platform built for lean IT teams and MSPs that need centralized visibility and control without maintaining heavy infrastructure or complex analytics stacks.
Reviewers highlight how all managed devices can be tracked from a single dashboard, with alerts and system signals presented in a way that makes issues easy to identify and prioritize. This operational clarity supports faster triage and reduces time spent interpreting system noise.
G2 users describe being able to connect to endpoints quickly, run scripts, execute commands, and resolve issues without switching tools. Support for multiple remote access options adds continuity, helping teams stay productive even when individual services experience interruptions.
Patch management, background monitoring, and alert-driven workflows handle repetitive tasks that would otherwise require manual effort. Reviewers often connect this automation to fewer urgent escalations and more predictable workloads across daily operations.
Device and endpoint management is tightly integrated across the platform. Users frequently mention the ability to manage assets, apply updates, and maintain consistency across environments from a single system. This consolidation helps teams reduce tool sprawl while maintaining control over growing device fleets.
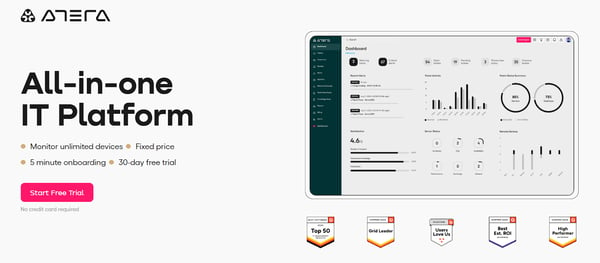
Atera scales in a way that aligns with how lean teams grow. Rather than introducing new layers of complexity as environments expand, the platform extends centralized control across more devices and users. This allows teams to scale their footprint without reworking workflows or operational structure.
Reporting focuses primarily on standard operational metrics and visibility. Teams that require highly customized reporting or deeper analytical exploration may find the reporting layer more limited compared to analytics-first AIOps platforms. The mobile app emphasizes monitoring, alerts, and awareness, which fit on-call and remote visibility needs. More advanced configuration and workflow setup are typically handled through the web interface rather than on mobile.
Overall, Atera addresses a core operational problem for IT teams: maintaining visibility, control, and consistency across distributed systems without adding platform overhead. Based on G2 reviews and satisfaction signals, it stands out for teams that prioritize execution, automation, and operational clarity, making it a strong fit within the AIOps category for lean IT environments and MSPs.
What I like about Atera:
- Atera unifies monitoring, remote access, patching, and ticketing in one view, allowing teams to track devices, respond to alerts, run scripts, and connect to endpoints from a single dashboard.
- The platform’s automation handles monitoring, patching, and alert-driven workflows automatically, reducing manual work and speeding issue resolution.
What G2 users like about Atera:
“I like how easy it is to keep track of all my client machines from one dashboard. The remote access feels smooth, and I can jump into a device without wasting time. The alerts are simple to understand, so I know exactly what needs attention. I also like the patch management feature because it handles a lot of the small tasks for me, which saves time in my daily work.”
– Atera review, Carlos M.
What I dislike about Atera:
- Atera’s reporting focuses on standard operational metrics, suiting execution-driven teams with limited flexibility for deeper or customized analysis.
- Advanced capabilities, including AI-driven features, are add-ons, supporting modular adoption rather than default inclusion.
What G2 users dislike about Atera:
“Some advanced features feel limited compared to larger enterprise tools. Reporting could be more customizable, and the integrations list, while growing, still lacks a few popular options. Sometimes there’s a slight delay when remote-connecting to devices, and the mobile app could use more functionality. Support is generally helpful but can take time to respond during busy hours. Still, for the price and simplicity, these are small trade-offs.”
– Atera review, Ashley T.
AIOps platforms often rely on application telemetry to detect anomalies and predict incidents. See which application performance monitoring tools help capture the performance data AIOps systems analyze.
2. ServiceNow IT Operations Management: Best for enterprise AIOps and service operations
ServiceNow IT Operations Management is deliberately built for large-scale, interconnected IT environments. This comes through not just in positioning, but in how the platform is designed to support operational complexity rather than abstract it away. From the outset, it’s clear this is a platform designed for organizations managing deeply connected services, infrastructure, and workflows at scale.
Reporting is particularly strong for service-centric incident analysis, earning a 93% rating, and reviewers frequently describe how service mapping and event management work together. Instead of reacting to isolated alerts, teams can see how issues cascade across services and underlying infrastructure.
Alerting is rated at 91%, while decision support scores 90%, reflecting how incidents are ranked based on real service impact rather than event volume alone. Reviewers consistently mention improved triage efficiency, especially in environments where thousands of events compete for attention.
Automated discovery and application service mapping are another area where ITOM delivers clear operational value. Static diagrams are replaced with continuously updated architecture views, giving teams confidence that dependencies reflect reality. Users often note faster root-cause identification when failures occur, reducing time spent manually correlating infrastructure and application data.
ServiceNow ITOM integrates directly with ITSM, keeping incidents, dependencies, and remediation workflows within a single operational system. Reviewers highlight the benefit of having production issues and service relationships visible end-to-end, particularly in hybrid and multi-cloud environments where coordination gaps are common.
The platform offers extensive flexibility to accurately model complex systems and dependencies, which is essential for organizations operating across diverse infrastructure. Reviewers often describe this configuration depth as critical for maintaining reliable service visibility as environments evolve.
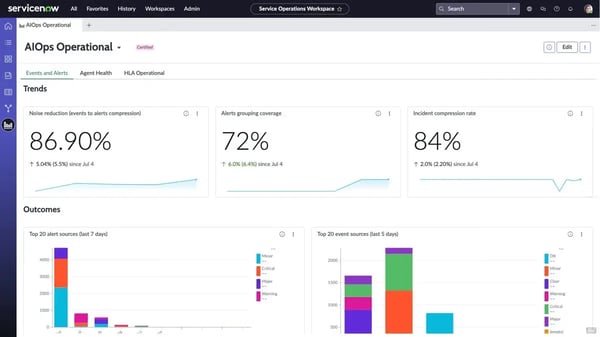
AI capabilities emphasize orchestration and decision-making over full autonomous remediation, prioritizing auditability and oversight, which can feel less hands-off for teams expecting fully autonomous resolution. The platform’s high level of configurability benefits large organizations but requires more planning and ownership during setup and modeling, and teams without prior ServiceNow experience may need additional time to fully operationalize it.
Overall, ServiceNow ITOM is a strong fit for enterprise teams operating complex, mission-critical environments where service visibility, governance, and structured workflows matter. For organizations that value contextual incident management and long-term operational confidence over lightweight automation, it continues to stand out as a scale-ready AIOps platform based on consistent reviewer feedback.
What I like about ServiceNow IT Operations Management:
- Service mapping and event management provide end-to-end visibility by showing which application components are impacted, helping teams prioritize incidents based on real service context.
- Discovery, reporting, and event correlation connect infrastructure data with ITSM workflows, enabling faster movement from detection to resolution without switching tools.
What G2 users like about ServiceNow IT Operations Management:
“I love how service mapping and event management work together to provide end-to-end visibility. I also appreciate being able to see the exact components that are impacted when something goes wrong with my application service. Additionally, the system is easy to set up.”
– ServiceNow IT Operations Management review, Mohamed A.
What I dislike about ServiceNow IT Operations Management:
- The platform’s breadth and configurability require upfront time and expertise, which may feel heavy for teams looking for lightweight or fast AIOps deployment.
- The automation model emphasizes oversight and control, supporting governance but leaving some remediation steps manual rather than fully hands-off.
What G2 users dislike about ServiceNow IT Operations Management:
“ServiceNow ITOM can be complex to implement, requires significant configuration and expertise, and its licensing costs are high. Some users also find performance issues with large-scale environments and integration challenges with non-ServiceNow tools.”
– ServiceNow IT Operations Management review, Souhaib A.
Network visibility is a key input for AIOps-driven incident detection. Explore the best network monitoring tools that provide the data needed for intelligent infrastructure insights.
3. IBM Instana: Best for automated APM and fast deployment
IBM Instana focuses on real-time application behavior and continuous performance visibility across dynamic environments. It is commonly used in systems where applications, infrastructure, and AI-driven workloads change rapidly, placing a premium on speed and low manual intervention. Reviewers frequently describe how quickly teams can surface and understand issues once the platform is in place, supporting response while incidents are still unfolding.
Continuous, real-time data ingestion is central to how teams operate with Instana during incidents. Metrics, traces, and events update continuously, allowing dashboards to reflect live system behavior rather than delayed snapshots. This immediacy helps teams understand what is happening as conditions change, instead of reconstructing timelines after systems stabilize.
Instana automatically correlates metrics, traces, and service dependencies across infrastructure, allowing teams to pinpoint where failures originate without manual cross-referencing. This aligns with G2 feedback, where Root Cause Identification is rated at 92%, reinforcing how consistently teams rely on this capability during active incidents.
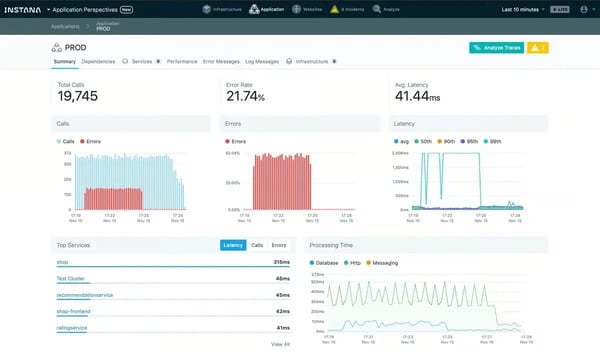
Teams describe being able to follow individual requests across services in a single view, which speeds up debugging in microservice-heavy architectures. This visibility helps engineers isolate bottlenecks and failures without first investing time in custom instrumentation.
Automatic discovery keeps observability aligned with rapidly changing systems. As new services are deployed, Instana detects them, maps dependencies, and begins collecting metrics immediately. This reduces blind spots during frequent releases and supports environments where manual setup would otherwise slow teams down.
Deployment-aware context helps teams interpret incidents during periods of change. Reviewers mention being able to view performance issues alongside recent deployments or infrastructure updates, making it easier to assess whether a change contributed to an incident. This context shortens investigation cycles when releases and failures overlap.
Teams note that problems become clear quickly once alerts fire, without waiting for extended data collection or post-incident analysis. This supports earlier intervention when systems begin to degrade.
IBM Instana’s usage is concentrated among mid-market (45%) and enterprise teams (45%), with smaller organizations making up a smaller share. This distribution aligns with environments where system complexity and deployment velocity are higher.
Broader G2 signals offer an additional perspective on the overall perception. Instana holds an overall G2 Score of 80 pointing to strong visibility in larger operational environments, with sentiment varying based on expectations and implementation depth.
The interface prioritizes comprehensive system views, which can impact responsiveness at scale. In very large environments, loading extensive service maps with many dependencies may take longer, so teams factor this into investigations. Alerting is designed to surface even short-lived anomalies, which improves visibility during brief spikes or transient failures, but some teams report higher notification volumes during short fluctuations and often adjust thresholds to better control noise.
Overall, IBM Instana is most often evaluated in environments where systems change quickly, and visibility needs to keep pace. Based on reviews and usage patterns, it is commonly used by teams operating microservices, AI-driven workloads, and large application ecosystems. Within the AIOps category, it is typically associated with real-time observability in fast-moving operational contexts.
What I like about IBM Instana:
- IBM Instana delivers near real-time monitoring across applications and infrastructure, helping teams investigate incidents quickly without waiting on dashboard refreshes.
- Its default automation includes automatic service discovery and distributed tracing, mapping dependencies, and surfacing metrics immediately as new services are deployed.
What G2 users like about IBM Instana:
“I find IBM Instana’s AI-based staging feature to be a standout element, allowing for easy installation on any platform, which is a very good feature. The simplicity of the setup is remarkable, with minimal effort required beyond providing credentials, and it quickly becomes operational. This ease of setup is complemented by its effective monitoring capabilities, as you can log in from various systems and view the monitoring dashboard effortlessly. It requires no additional configuration on virtual machines, which is particularly valuable. Overall, the installation process’s ease and its quick readiness for use work exceptionally well for me.”
– IBM Instana review, Pratham M.
What I dislike about IBM Instana:
- The interface and service maps provide deep visibility into system relationships, but large topologies can take longer to navigate in complex, distributed environments. This depth tends to work well for teams managing multi-service architectures where understanding dependencies is critical.
- The alerting model is highly sensitive to short-lived and sustained anomalies, which can increase alert volume in dynamic systems and require active prioritization. This sensitivity aligns well with teams that prioritize early detection and granular monitoring across fast-moving infrastructure.
What G2 users dislike about IBM Instana:
“One thing that I find could be improved with IBM Instana is the UI speed. While powerful, it sometimes feels a bit heavy, especially when loading large service maps. The alerting is generally effective, but it can be somewhat noisy if things spike for just a few seconds. Furthermore, the pricing can accumulate quickly as the environment grows. Overall, while IBM Instana works well, a lighter interface, smarter alert tuning, and a slightly simpler pricing structure would enhance its value.”
– IBM Instana review, Ayan S.
Modern AIOps platforms depend on real-time cloud telemetry to identify patterns and automate responses. Compare the leading cloud monitoring tools that power data-driven operations.
4. Dynatrace: Best for full-stack observability with AI-assisted root cause analysis
Dynatrace functions as an observability backbone across large SaaS environments where uptime, data continuity, and system awareness are critical. It maintains continuous visibility into applications and their dependencies, helping teams keep complex systems consistently understood.
G2 reviewers highlight how Dynatrace shortens the gap between detection and understanding. Root cause identification consistently stands out, supported by Davis AI and SmartScape, which automatically map dependencies and surface the entities driving incidents. Its highest-rated G2 features, Root Cause Identification (90%), systems monitoring (89%), and alerting (88%), reinforce this capability, helping teams respond faster and more confidently during incidents.
Dynatrace does a good job balancing breadth with operational clarity. Teams frequently mention that implementation feels approachable relative to the scale of the platform. The interface supports quick orientation even for users new to enterprise observability tools, allowing developers and operations teams to collaborate efficiently.
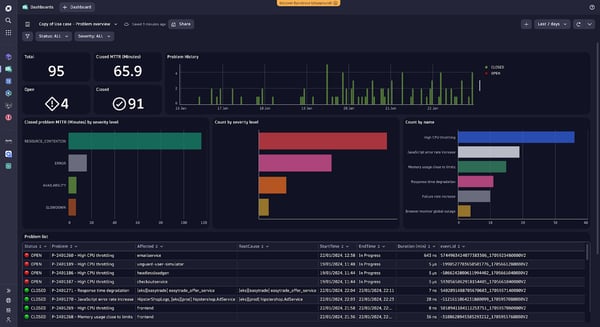
Multidimensional analytics, distributed tracing, and client-side metrics provide a shared view of system behavior. Reviewers note that this depth supports thorough investigations and ensures both development and operations teams can track performance consistently across complex SaaS stacks.
Integrations with platforms like ServiceNow, PagerDuty, and Microsoft Teams extend observability insights directly into incident response workflows. Users describe smoother coordination during outages, with alerts and contextual data delivered to the tools they already rely on.
From a business impact perspective, reduced mean time to resolution is mentioned most consistently. Reviewers report identifying issues within minutes, drilling into root causes automatically, and restoring stability without prolonged manual investigation. Consolidating multiple monitoring and performance tools into Dynatrace also improves operational efficiency.
Adoption patterns reflect a strong enterprise fit. With 71% of users from enterprises, 23% mid-market, and only 6% small businesses, Dynatrace demonstrates traction in environments where resilience, recovery planning, and observability at scale are critical.
Some reviewers note that Dynatrace’s coverage is more selective for certain environments. Legacy systems such as IBM iSeries and specific frontend or API-level monitoring scenarios may require adjustments, and teams occasionally experience moments of adaptation as the interface evolves. While implementation is generally approachable, understanding advanced features like multidimensional analytics or distributed tracing may require additional orientation or training.
Overall, Dynatrace is a strong fit for enterprises where SaaS reliability, recovery readiness, and operational visibility are tightly linked. For teams seeking fast root cause identification, faster incident response, and a way to consolidate multiple monitoring tools, Dynatrace provides a comprehensive, enterprise-ready observability solution.
What I like about Dynatrace:
- Dynatrace’s Davis AI, SmartScape, and distributed tracing help teams move quickly from detection to root cause, with strong alerting and incident-time visibility.
- The platform’s unified view brings application, infrastructure, and user experience metrics together, supported by integrations with ServiceNow, PagerDuty, and Microsoft Teams.
What G2 users like about
“The way it automatically maps out services and dependencies is genuinely helpful. Instead of guessing where an issue might be coming from, I can usually spot it pretty quickly. I also like how the dashboards pull everything together in a way that actually makes sense, even when there’s a lot of data flying around. Another thing I appreciate is the alerts.”
– Dynatrace review, Sourabh K.
What I dislike about Dynatrace:
- The platform’s breadth aligns well with large, complex environments where teams manage multiple services and configurations. Organizations expecting a more streamlined or minimal interface may find the feature set more extensive than that of lightweight monitoring tools.
- Reporting and monitoring depth are optimized for core operational use cases, which may feel more structured for teams with highly specialized or legacy-specific needs.
What G2 users dislike about Dynatrace:
“It’s quite tough to learn and understand how to use the tool. The learning curve is high. Pretty expensive. If not configured correctly, you will bleed money. Just due to the learning curve, we found the frequency of users using apps going down.”
– Dynatrace review, Sunil A.
5. Datadog: Best for engineering-led observability for cloud-native stacks
Datadog is designed for teams operating at scale and managing complex, high-volume production environments. The platform is most commonly adopted by mid-market organizations (53%) and enterprises (36%), which aligns closely with its G2 Market Presence score of 84. Its overall G2 Score of 70 and G2 Satisfaction Score of 56 reflect a product built for teams with established operational ownership rather than lightweight monitoring needs.
Reviews consistently highlight the ability to view metrics, logs, traces, and application performance in a single system, which reduces context switching across tools. This consolidated view helps teams correlate infrastructure behavior with application-level issues, especially in environments running many services in parallel.
Alerting is rated at 98% and Systems Monitoring at 96% on G2, both well above category averages. Teams frequently connect these capabilities to earlier detection of anomalies and faster response during incidents.
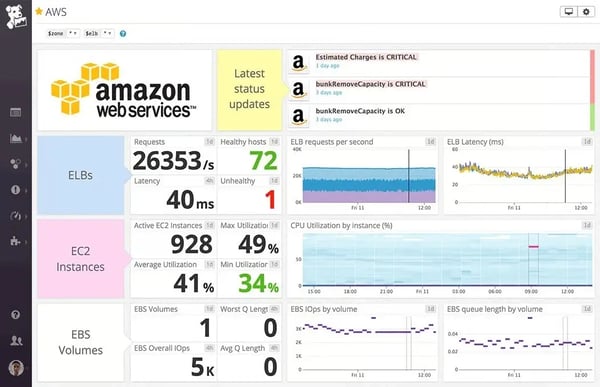
Its AI capabilities score 93% on G2, reinforcing how anomaly detection, forecasting, and pattern recognition are embedded into the platform. Users describe these features as reducing manual investigation by surfacing meaningful signals before issues escalate.
Dashboards are highly configurable, allowing teams to tailor views around services, environments, and ownership models. This flexibility is often cited as valuable for organizations whose observability requirements evolve alongside system complexity. Teams also describe tracing issues from user experience through application code and down to system resources. This end-to-end visibility supports faster root cause analysis across distributed systems.
Integrations with tools like Slack, OpsGenie, and IDEs extend Datadog’s observability workflows. Teams highlight being able to move from detection to investigation without leaving their primary operating tools. This integration depth reinforces Datadog’s role as a central operational platform rather than a standalone monitoring tool.
Teams often scrutinize a few areas, with cost transparency being the most cited. Datadog’s pricing reflects the volume and brea