


What triggers an AI Overview? What types of queries are most likely to generate an AIO, and which are relatively safe? Can we predict where AIOs will appear, and even target SERPs without them?
To answer these questions, we analyzed our database of 146 million SERPs and explored how often AI Overviews appeared for 86 different keyword traits, from YMYL to CPC to query length.
Across our data set, AI Overviews appear for 21% of keywords. But looking at specific keyword categories, some categories have as high as a 60% chance of triggering an AI Overview, and others as low as 1%.
- AIOs appear on 21% of all keywords.
- 99.9% of AIOs appear on Informational intent keywords
- AIOs are 1.9x more common for non-branded keywords than branded keywords
- AIOs appear on 46% of 7+ word queries
- AIOs appear for 57.9% of all question queries
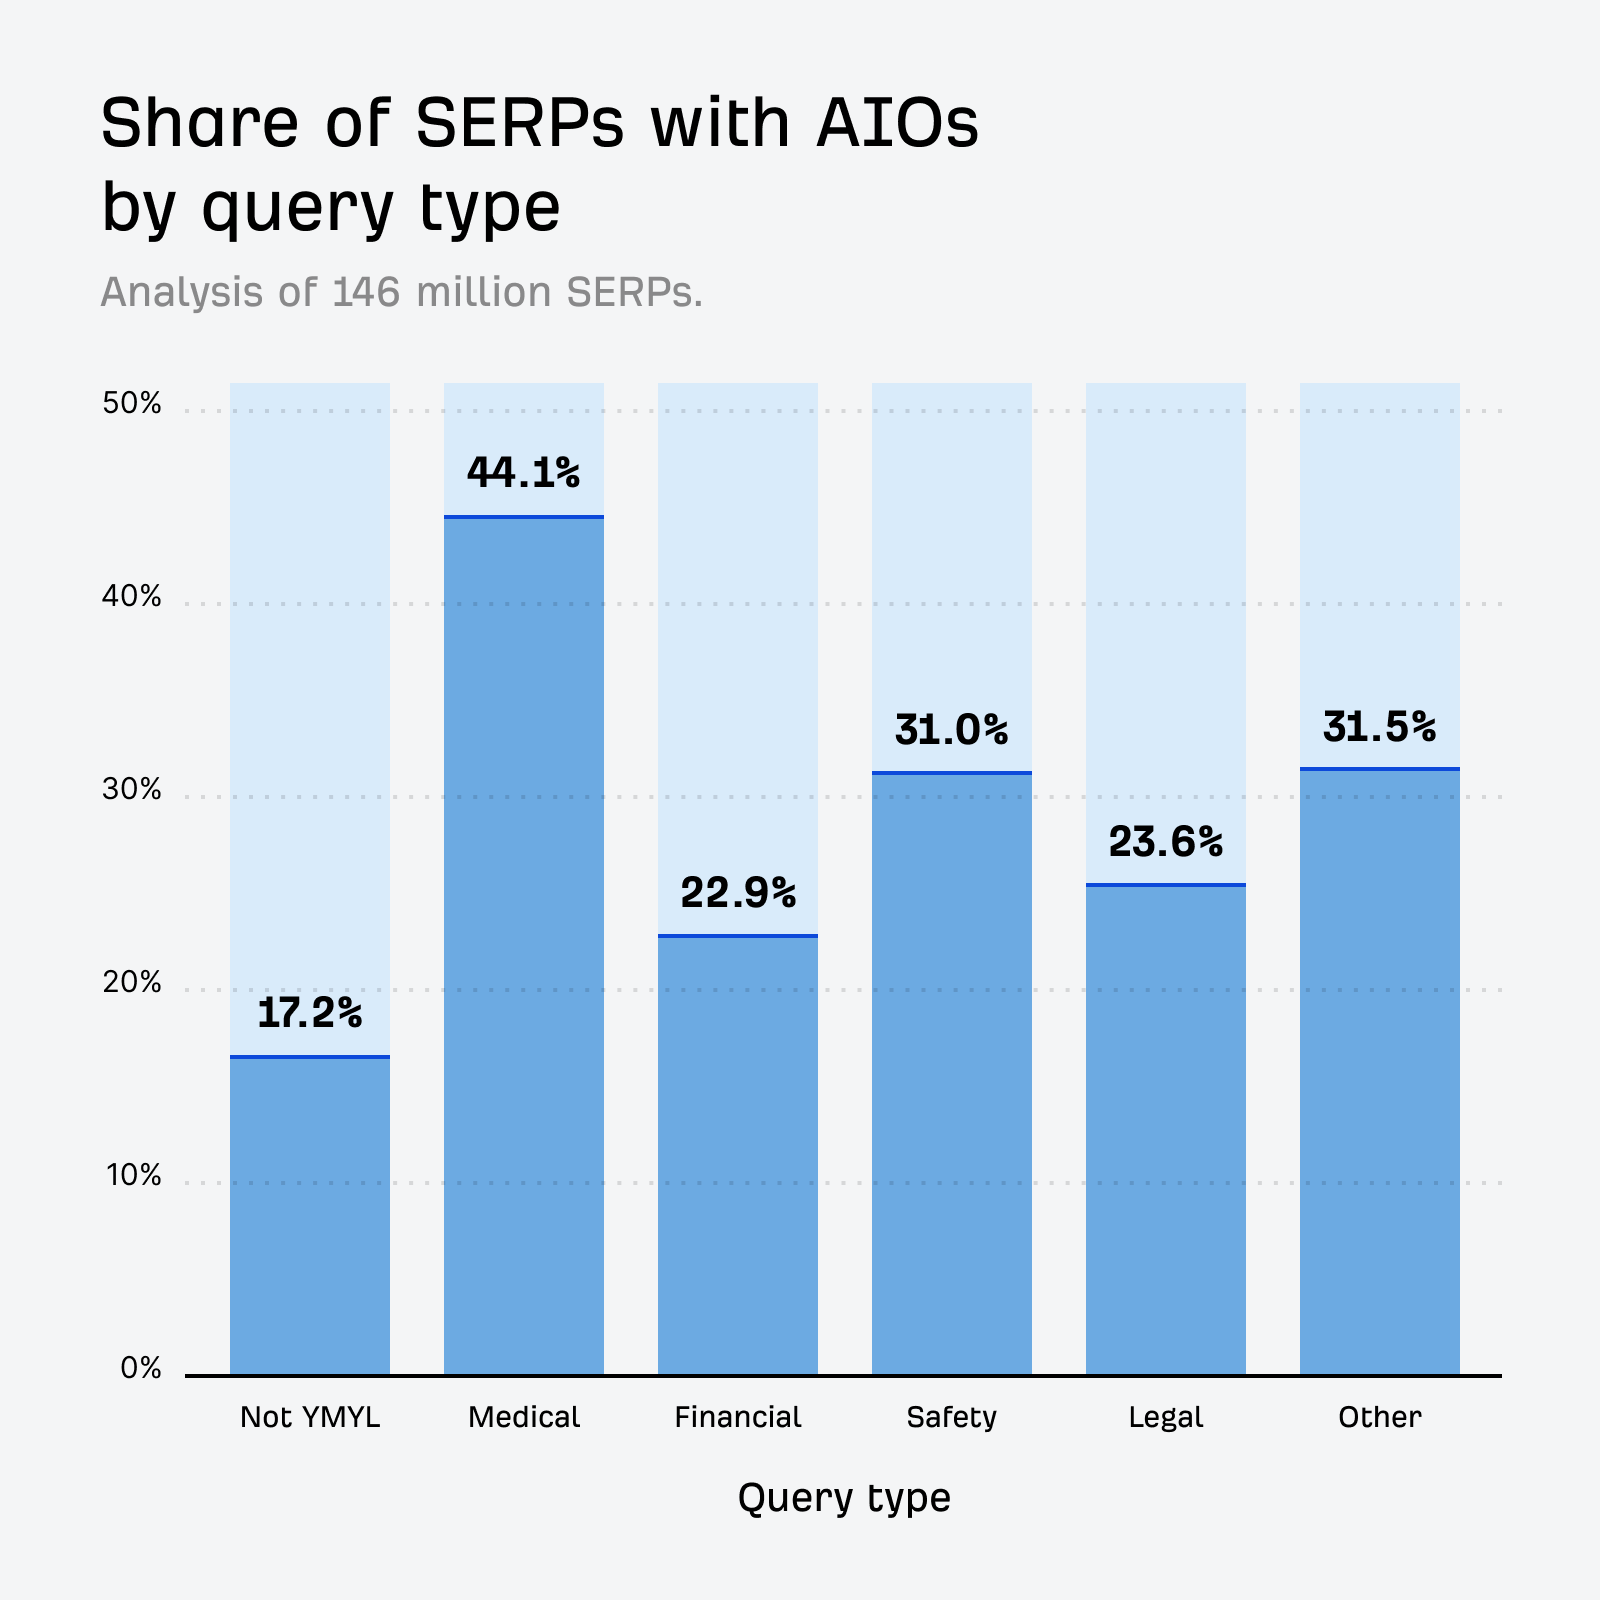
- 44.1% of Medical YMYL queries trigger an AI Overview
- Only 6% of news queries trigger an AI Overview
- The categories with highest AIO share are Science (43.6%), Health (43.0%), Pets & Animals (36.8%), and People & Society (35.3%).
- The categories with lowest AIO share are Shopping (3.2%), Real Estate (5.8%), Sports (14.8%), and News (15.1%).
- Only 4% of NSFW queries trigger AIOs
- Only 7.9% of local searches trigger an AI Overview
About this data
All data is from September 2025. Keyword categories are derived from our internal keyword categorization systems.
If you’re an Ahrefs user, you can access this data yourself. Just head to Keywords Explorer and use the SERP features filter to see all keywords that trigger an AI Overview, and filter by dozens of variables like intent, volume, and growth rate:

You can also analyze any brand, website, or product’s visibility in AI Overviews using Brand Radar.
Just enter your brand to analyze your mentions, citations, estimated impressions, and even share of voice across millions of AI Overviews:

AI Overviews appear on 20.5% of all SERPs (29,991,998 out of 146,122,391).

Put another way, most websites can expect to compete with a Google-branded, AI-generated blog post for 1 in every 5 of the keywords they target.
We can use this rate as a baseline to see whether different keyword characteristics—like intent, length, or CPC—make it more or less likely for AI Overviews to trigger.
Here’s a chart summarising our findings. Query types with a positive difference from the baseline (i.e. bars on the right of the mid-line) are more likely to trigger an AI Overview; those with a negative difference (bars on the left) are less likely to trigger an AI Overview.

99.9% of keywords that trigger AI Overviews are Informational in intent. 5.5% of AIO keywords are considered Commercial, 1.2% Transactional, and just 0.1% Navigational.
Sidenote.
Keywords can have multiple intent classifications, hence the total summing to greater than 100%.
| Intent | Count | Percentage |
|---|---|---|
| Informational | 29,959,542 | 99.9% |
| Navigational | 26,413 | 0.1% |
| Commercial | 1,657,560 | 5.5% |
| Transactional | 366,400 | 1.2% |

Relative to the baseline rate of 20.5%, we can see that AIOs are slightly more likely to appear for Informational keywords, but vastly less likely to appear for other intent types, especially Navigational. Just 0.09% of Navigational keywords trigger an AI Overview:
| Intent | AIO SERPs | Total SERPs | Percentage |
|---|---|---|---|
| Informational | 29959542 | 140287290 | 21.4% |
| Navigational | 26413 | 2909989 | 0.9% |
| Commercial | 1657560 | 38117465 | 4.3% |
| Transactional | 366400 | 17806400 | 2.1% |

76.3% of keywords that trigger AIOs are considered non-branded (e.g. seo tools), with the remaining 23.7% categorised as branded searches ( e.g. Ahrefs).
| Label | Count | Percentage |
|---|---|---|
| Branded | 7,095,160 | 23.7% |
| Non-branded | 22,896,838 | 76.3% |

AIOs are 1.9x more likely to appear on non-branded queries, triggering on 13.1% of all branded queries and 24.9% of non-branded queries in our SERP database.
| Label | AIO SERPs | Total SERPs | Percentage |
|---|---|---|---|
| Branded | 7095160 | 54150524 | 13.1% |
| Non-branded | 22896838 | 91971867 | 24.9% |

Compared to the baseline, AI Overviews rarely appear for 1-3 word queries, but often trigger for 5-7+ word queries.
It seems that the longer the search query, the greater the chance an AI Overview will appear. AIOs appear on just 9.5% of single-word queries, but that figure jumps to 46.4% of all queries with seven or more words.
| Query length | AIO SERPs | All SERPs | Percent |
|---|---|---|---|
| 1 | 471691 | 4964588 | 9.50% |
| 2 | 2537067 | 25594777 | 9.90% |
| 3 | 5740261 | 40931537 | 14.00% |
| 4 | 6315178 | 32365814 | 19.50% |
| 5 | 5321458 | 19303206 | 27.60% |
| 6 | 3935672 | 10753233 | 36.60% |
| 7+ | 5670671 | 12209236 | 46.40% |

66.5% of keywords that trigger AIOs are categorized as questions.
| Label | Count | Percentage |
|---|---|---|
| Question | 10,045,913 | 33.5% |
| Not question | 19,946,085 | 66.5% |

In total, AIOs appear on 57.9% of all question queries, while non-question queries show a lower rate of AI Overviews compared with the baseline, at 15.5%.
| Label | AIO SERPs | All SERPs | Percent |
|---|---|---|---|
| Question | 10045913 | 17361451 | 57.90% |
| Not question | 19946085 | 128760940 | 15.50% |

There seems to be little obvious correlation between keyword CPC buckets and AI Overview appearance, with most hovering within a couple of percentage points of our 20.5% baseline:
| CPC (USD) | AIO SERPs | All SERPs | Percent |
|---|---|---|---|
| 0.00-0.10 | 2427764 | 8787818 | 27.6% |
| 0.10-0.20 | 847079 | 4573228 | 18.5% |
| 0.20-0.50 | 1740808 | 14057337 | 12.4% |
| 0.50-1.50 | 2435272 | 13550276 | 18% |
| 1.50-5.00 | 1511232 | 7709489 | 19.6% |
| 5.00-20.00 | 302047 | 1576723 | 19.2% |
| 20.00+ | 20943 | 132852 | 15.8% |

Almost a third (32.3%) of the keywords that trigger AI Overviews are categorised as YMYL (Your Money or Your Life) queries.

Given that YMYL queries are—according to Google themselves—deserving of extra care and attention, it seems surprising to see AI-generated answers so prevalent.
In fact, AI Overviews are more common for YMYL queries than normal queries. 34.3% of all YMYL queries trigger an AI Overview, far higher than our 20.5% baseline. Non-YMYL queries are less likely to trigger AIOs, at just 17.2%:
| Label | AIO SERPs | All SERPs | Percent |
|---|---|---|---|
| Not YMYL | 20291372 | 117843464 | 17.2% |
| YMYL | 9700626 | 28278927 | 34.3% |

All YMYL categories—Medical, Financial, Safety, Legal, and Other—show an increased occurrence of AI Overviews.
This is especially true for Medical YMYL queries, with 44.1% of medical queries triggering an AI Overview—more than double the frequency at which AI overviews appear across all keywords.
| Category | AIO SERPs | All SERPs | Percent |
|---|---|---|---|
| Not YMYL | 20291372 | 117843464 | 17.2% |
| Medical | 5924866 | 13430263 | 44.1% |
| Financial | 2027902 | 8859397 | 22.9% |
| Safety | 1215129 | 3922977 | 31% |
| Legal | 354573 | 1499855 | 23.6% |
| Other | 178156 | 566435 | 31.5% |
This has not gone unnoticed by SEOs in the healthcare industry:

If we categorise keywords by the industry they belong to, we can see that AI Overviews have hit some industries harder than others.
Compared to our baseline of 20.5%, the hardest hit categories are:
- Science (43.6%)
- Health (43.0%)
- Pets & Animals (36.8%)
- People & Society (35.3%)
- Internet & Telecom (30.3%)
- Reference (30.1%)
- Computers & Electronics (28.6%)
At the other end of the spectrum, AI Overviews seem unlikely to trigger for other industries, especially those related to commerce and news content:
- Shopping (3.2%)
- Real Estate (5.8%)
- Sports (14.8%)
- News (15.1%)
| Category | AIO SERPs | All SERPs | Percent |
|---|---|---|---|
| Adult | 44106 | 3599311 | 1.2% |
| Arts_and_Entertainment | 1882795 | 14009774 | 13.4% |
| Autos_and_Vehicles | 1269893 | 6762380 | 18.8% |
| Beauty_and_Fitness | 859603 | 4679157 | 18.4% |
| Books_and_Literature | 317298 | 1526539 | 20.8% |
| Business_and_Industrial | 936352 | 5757412 | 16.3% |
| Computers_and_Electronics | 1675947 | 5862964 | 28.6% |
| Finance | 1355373 | 5451993 | 24.9% |
| Food_and_Drink | 1804833 | 9680182 | 18.6% |
| Games | 736028 | 5362070 | 13.7% |
| Health | 6638182 | 15436927 | 43% |
| Hobbies_and_Leisure | 303138 | 2256793 | 13.4% |
| Home_and_Garden | 1755813 | 9540446 | 18.4% |
| Internet_and_Telecom | 377053 | 1244501 | 30.3% |
| Jobs_and_Education | 1092337 | 6075319 | 18% |
| Law_and_Government | 898760 | 3889739 | 23.1% |
| News | 746414 | 4948735 | 15.1% |
| Online_Communities | 218816 | 1071306 | 20.4% |
| People_and_Society | 1665904 | 4722623 | 35.3% |
| Pets_and_Animals | 1179593 | 3203717 | 36.8% |